It is certainly affected on that trade. I think @EmeraldEyes is saying that it’s not affected over 10,000 trades, and that this is what matters?
1 Like
Doesn’t matter. Odds of profitability/expected value are the same. 1 trade or 10,000.
Well it’s 3pm here in Cambodia and I’m bored silly - so sorry @tommor I’m going to have another go on your wonderful thread - hope you don’t mind.
This entry - exit dichotomy.
It’s all time relative, I will quote directly from Tom Hougaard, a quote that has also been made by Linda Raschke and Al Brooks -
‘If you strip away the time and price axis of any chart you will likely be unable to differentiate between a five minute chart and an hourly chart.’
As @SovoS has pointed out - he uses 1hr charts and my strategy seems to apply, he even uses a very similar strategy.
What I would like to say is that as a 5mins/1min trader - the entry point is magnified and this becomes more critical as stake size is increased and SL is smaller.
Higher timeframes are perhaps more fundimentally driven by institutions trying to shovel money on and a small difference, not being so magnified over a longer timeframe, makes entry less significant.
Using MAs etc for exit can still apply.
MAs are so valuable because and to quote Linda Raschke ’ Price has a habit of continuing to do what it has been doing over a period of time’. As traders, and I mean ‘trend traders’ this is the advantage we have over the randomness of the market and indeed the coin-toss scenario.
Regarding ‘risk starts when trade starts’ - No I believe that you choose your risk as a bet ie stake size and SL. Consider that you have already lost when you click ‘go’. Accept losses, it’s betting - if you are right you win, if you are wrong accept you lose what you risked and be happy with the short term randomness of the market.
If you have a proven strategy - use it, stick with it. We are playing a probabilities game - it’s the long term that matters.
@tommor Thank you for starting another of your wonderful threads and helping to relieve the boredom of an old decrepit Englishman who is 6000 miles away and sometimes feels like he is on a different planet! ![]()
5 Likes
Not confusing at all - just statistical manipulation that has no meaning in reality it just a statistics riddle.
It is similar to arguing that you can never reach a destination because before you can reach it you have to reach half way. And before you can reach it from that point you have to again reach half way… and so on and so on. I.e. it is infinite because you are always left with the remaining 50% and therefore can never arrive at your destination.
Even to start with, this, in my experience is a totally wrong supposition. Markets are not random and tend to continue in the same direction when a trade is in place. Identifying that trend (or lack of) is why we analyse price. The probability of profit is far greater when trading with a trend than 50% provided one is focusing properly on one’s exits.
Whether one’s risk factor is 50/50 or something entirely different depends on how one reads the chart. The likelihood of price reaching certain levels in either direction. As has been already said here, and by me on many other threads, probability is our product, whatever instrument we choose.
We estimate the directional probability and then combine that with managing the exposure risk. Its kind of what insurance companies are doing all the time in defining their premiums.
Where we enter and where we get out are the very crux of trading success - and the long term result is nothing more than the cumulative result of all the individual trades along the way.
If that 50/50 claim were true, why, then is my win rate consistently between 70-75%?
Why then even bother with back-testing at all?
I am not a fan of back-testing anyway. At best, it might provide an indication of might be anticipated.
But mainly it will only be misleading and unreliable because market structure is changing constantly and nowadays even faster as we can anticipate automation and AI having progressively more impact on market activity.
At its worst, back-testing is deceptive and distracting as it cannot, by definition, include the human factor such as character and emotions and assumes we take every trade that fits the programmed parameters - but lin reality life often gets in the way of that.
We already have two examples of this in this very thread where, on one occasion, the trader is driven to revenge trading, and the other occasion where the strategy gave an excellent profitable trade (which backtesting would assume was initiated) but where was the trader? On his balcony having a smoke and sorting out his phone operator.
Backtesting cannot anticipate the fact that “life” happens, all the time.
So I prefer to leave statistics to the statisticians and trading to the traders. ![]()
PS. I accept that backtesting an automated system could be beneficial.
But beyond this, I am not really qualified to speak as I haven’t investigated this topic any deeper, and I am surely just a naive has-been, so I’ll just shut up and wait to hear @Tommor’s progress next week with the indices… ![]()
4 Likes
I absolutely agree with everything you say here!
And I do deserve a bollocking! ![]()
3 Likes
Maybe not so much, John. This welcome thread shows Babypips at its best. I wish there more like this.
5 Likes
There would be, if experienced, knowledgeable members like yourself and @TheodoreThring didn’t keep complaining about all the promotional posting (which I also see, but it doesn’t put me off) and gradually leaving.
All that does is make the balance worse, rather than improving it.
Try using your “ignore” list instead, and interact only with the people you like, like those chatting in this thread! ![]()
Just a suggestion, Mr. Herring. ![]()
4 Likes
On the contrary! I deeply respect your open and honest expression of your humanity. It is what we are! We are not machines. Sometimes things just purr along and other times everything goes wrong no matter what we do (or don’t do).
If we are trading manually then we will all miss some trades, enter trades late, enter long instead of short, 10 lots instead of 1, and so on. We all do it at some time or another. ![]()
I remember vividly my most embarrassing mistake. I entered a trade but it didn’t appear on the chart, so I entered it again. It still didn’t appear. I assumed that there was a problem with my internet and tried 5 times in total and no trades appeared on the chart…
Only then, did I realise that I had just recently been looking at a chart for a different instrument and hadn’t gone back to my own instrument chart…
So I hurriedly turned back to the correct chart and there they were, all five trades, all open and all laughing at me. It didn’t cost me too much, but it was a pretty strong lesson! ![]()
We are all human, we all do things. ![]()
5 Likes
I agree.
I have 41 members on my “Ignore” list.
I’m going for the record.
4 Likes
That’s amazing. You have your own money printing machine then. I think I’m right near 50-55% on 1:1 & 1:0.8 trades, . More focusing on the W-L distribution of strategies. Ie; A 50/50 that patterns W-W-W-L-L-L vs one that W-L-W-L-W-L. The less variance in the W/L distribution, the better.
3 Likes
Well not quite! As you know, win rate does not tell even half the “story”. And that is why I and @Tommor emphasise so much that one’s exit strategy is where the bottom line is made - how much is actually banked.
I don’t use any mathematical formula for R:R as I don’t see any feasible mathematical connection between how far price might go in one direction and how far it might reverse in the other direction. But usually my trades approximate to around 1:1-1.5.
When I see an opportunity in the chart I look at the potential extension in the profit direction and how far it can reverse before negating the signal. If the two “halves” make sense, i.e. the potential reward justifies taking the risk, then we have a trade.
But I am not slow to cut trades quickly if they are not performing as expected and a bit slow. This means I do have a number “wins” with smallish gains.
So whilst a high win rate might show the relative number of gains, it doesn’t show the relative amount of those gains. But I’m doing ok ![]()
Thanks for your input here, btw, very positive and useful! ![]()
3 Likes
@tommor
Just a quick note to wish you well with the indices if you are starting back on them this week (UK100?).
We’ve got some inflation and interest rate events later this week and it might be a bit wobbly from time to time- but I guess you are more than familiar with that! ![]()
1 Like
My primary index to trade is the S&P500.
After that bullish FTSE100 members.
Followed by the FTSE100 itself
When the S&P is in an established bull phase I can be tempted into parallel longs on the Dow and Nasdaq but I give these positions less time to reach break-even.
1 Like
Nice post, @SovoS! ![]()
Yes for me, exit strategy has been way more important than entries. A trader can be profitable with random coin flip entries, if he / she knows when & where to exit.
In my particular experience, knowing when & where to exit was a huge challenge until I upped my technical analysis game and became better at “reading” market movements.
Yeah, I personally found fixed SL and TP ratios to be a very poor substitute for actual R:R potential of a setup or asset.
In my experience, the magic happens when you can see the R:R potential of an asset long before the actual setup happens. This completely changed my approach from scanning (and chasing) markets for potential setups—an exhausting & time consuming process—to getting ahead of the market and lying in wait for prices to come to me.
In other words, it’s analyzing where the A+ potential or better trades will be, instead of scanning markets for the best possible setups presently available.
Hope that made sense.
3 Likes
It will be your average win vs your average loss, and the win rate of the account. If you’re bagging >1R with a win rate of 70-75%, that’s amazing. I’ve never seen someone do that yet… at least not long enough to compose a reliable sample set. Can you link your stats or details?
Here are my current stats of the past 6 months:
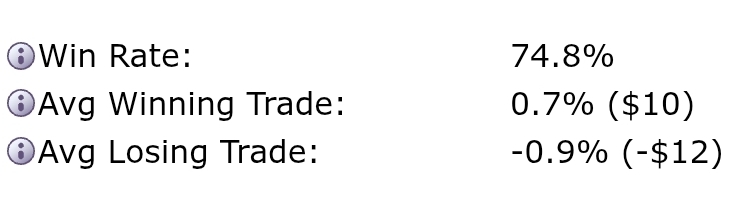
Expected win % of 0.83R ($10/$12) should be ~54% so I’m carrying a higher Risk of Ruin, but only goal is to double the acct before it fails. I don’t use Stops as my account is so small, and a fractal of my allocated capital that the account is the Stop Loss.
3 Likes
Yes, makes absolute sense and (if I have understood it right! ![]() ) echoes my own approach very closely - and expressed far more succinctly than I could ever put it!
) echoes my own approach very closely - and expressed far more succinctly than I could ever put it! ![]()
My approach is based on an MA band, or ribbon, that actually roughly equates with the MA/Keltner band used by @Johnny1974 .
I usually wait for the mkt to move into that band and then watch to see which side it then breaks out again.
Not only does this offer an acceptably close SL, somewhere on the other side of the band, but also usually signals a new burst of momentum that quickly determines whether there is a decent move or fade out. As you say, it is about waiting for the mkt to come to oneself rather than chasing price all over the place.
The same approach can be applied on most TFs but I prefer the 1H mainly because a) higher timeframes often require long waiting times and I don’t have the patience, and b) shorter timeframes have more fade outs and require more intensive screen time because the entry/exit levels are more critical since the moves are smaller.
Thanks for the post, very interesting…
3 Likes
Hi @EmeraldEyes,
I don’t actually keep any statistics at all apart from the win rate which is part of my trade journal. I used to keep all such performance stats but, you know, after a while I started to realise that instead of just reading the stats as a historical record, I was starting to gear my trades towards what I felt the stats should be showing, and that was a very negative pressure from both a success rate and motivational points of view.
The mkts do not move in any consistent manner and therefore one’s results are not going to be fixed either into any pre-defined stats or averages. The results are simply a mélange of what the mkts offer and how efficiently we trade them.
And, to be honest, that is how I follow it. I don’t anticipate anything or set any targets. I simply analyse each trade set-up on its own merits, as I mentioned previously, and off we go. As I also mentioned earlier, my (initial) SL v TP ratio tends to be about 1:1-1.5 when I consider a trade, anything less is not worthwhile and anything more is not likely to be achieved on a 1-hour TF. But the end result may well have a very different proportion depending on whether I have stepped in or not.
I guess my average trade duration is somewhere about 2-6 hours and if I am not seeing any anticipated movement then I close it. But even that does not tell the whole story. I only trade SP500, and sometimes I put on a trade early in the morning EU time but nothing happens until the US comes in some 6-8 hours later. But if I put on a trade in the US session then it can sometimes last 10 mins to 2 hrs! So, again, the average stats are not very useful.
But I feel that I should clarify here that trading has always been a secondary income for me. I have never wanted to trade full-time (I think that is a fool’s game for most people and will only ever be short-term before looking for other income means…). I have always focused on career jobs in companies and kept my trading as a private “hobby”. That way, I am never concerned with the level of profitability in any one month. I focus on the mkts, the risk/money management, the process, and what is going on in the world. I believe trading should be a challenge, enjoyable, and rewarding on both financial and personal levels. I don’t think I could achieve that as a full-time trader where profits have to reach certain levels on a constant and continuous basis in order to live…
But it would indeed be interesting to hear other traders’ attitudes towards stats.
3 Likes
Backtesting manual strategies comes down to making the process as realistic and consistent as possible. The simplest way is to pick a random point in past data, hide the future candles, and trade bar by bar while recording entries, stops, and exits. Do this across multiple pairs and market conditions so you see how the strategy holds up, not just in one trend. If you have coding skills, turning the rules into an EA and testing variations of trade management can help refine results even further.
Track results across different market conditions so you know if the method only works in trends or ranges.
The plan is simple.
I have a long on the S&P with a stop-loss at 2 x ATR20 below entry for a risk of -1r. There is a similar order at +2ATR: when this triggers I raise the SL on Position 1 by 2ATR to maintain the aggregate risk of -1r: simultaneously I set a third buy order at +2ATR with a SL at -2ATR.
When Trade 3 opens I move the SL’s on the first two positions up by 2ATR each, so the aggregate risk now becomes zero. Simultaneously set a fourth buy order at +2ATR with a SL at -2ATR.
It will be interesting to see how far this can go.
2 Likes
Good - somehow - to hear I’m not the only one to miss a trade for that (good and important) reason. ![]()
2 Likes