17/09/20 AUS200CASH SHORT:
SOLD @ 5890.80
S/L @ 5994.52
TP @ 5616.68


THE VERY SHORT TIME FRAME
As many of you will know, I am a professional punter. I have been punting for over 10 years now. Throughout those years, I had been forced to “adapt” to changing circumstances to stay up front.
In addition, the reason I love punting so much (which I do Wednesdays and Saturdays with the occasional Friday night and holidays when Metro racing is running in Australia) is that we know the result of a bet within a minute or so at the most.
I love the quick results and the excitement that comes with it. Trading the “Longer Term like Weekly or Day Charts, or even the Swing Trading of 4h - 2h charts” do not provide me with that “excitement”. It just doesn’t fit my personality. I usually spend an hour or two analysing the long term charts, make the decision and then execute. After that, is all about “waiting and staying out of the computer”.
So, I last week I spent sometime looking for those quicker results trades, and came up with the
5min GBP/USD chart.
I Demo Traded last week, with nice results, I identified the swings that we have including the dates & times, their range and duration.
Here is just one of the 13 major swings that occurred last week in the GU and the one I actually traded live. It was a nice quick overnight result.
At the end of it, I knew exactly what I needed to do today: Buy asap! Unfortunately we can’t buy on open of the new week market because of lack of liquidity and the brokerage spread being so high, so I had to wait for wave 2 to enter.
Wether it works or not, or I need to keep testing, only time will tell.
Because is only new, I am of course investing only a 1/4 of my usual trade size. So about 0.5%
Wait and see… Hope you “adrenaline junkies” like it.
The only issue will be for me to update a post quick enough since we are talking about 5min candles! And every pip counts.
We are looking at a typical risk of no more than: 20 pips
And a TP ranging from 50 - 150 pips depending on the day, and when we entered.
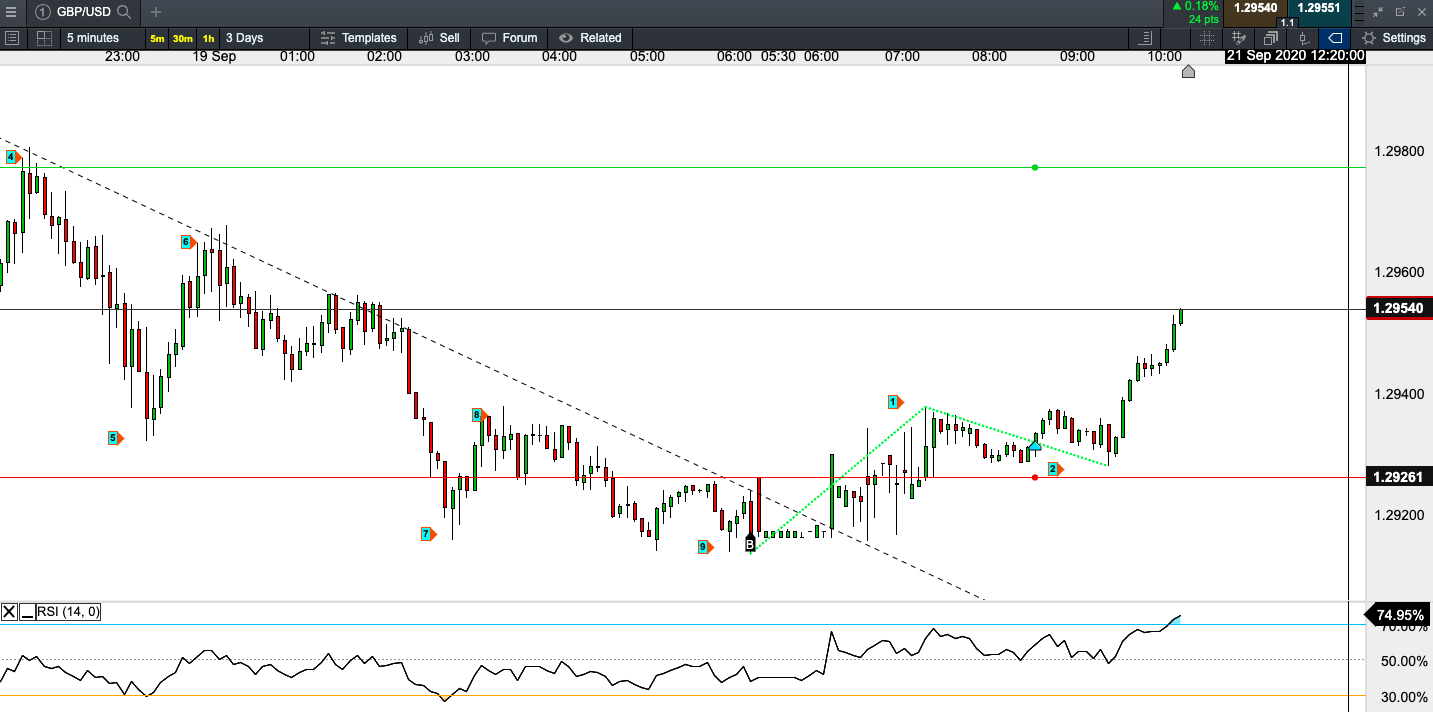
Last Week’s Live Trade: Short @ 2 (down red arrow)

As we can see above, between points 7-9 there is a “triple bottom” plus “RSI Divergence” formed plus Bull Candles like hammers, engulfing. Before the market open, I had marked the opening “Buy” with a “B” arrow shown. As mentioned, it is not possible to buy on open of a new week, but there were a few other opportunities between 9 and 1, which I missed, so I waited for what I felt would be point 2 which happened at the 38% Fibonacci level and had a bull engulfing candle.
By about noon or so, we should have reached our TP which is currently at 45pips (1.2977) which it is about 60pips from the new Up Move low (1.2914). I expect a move in average of 100pips which makes a high at 1.3014, but given that this is a new strategy, I am going conservative at the average of the two smallest ranges that occurred last week (50-75).
Today’s, Monday 21 Sep 20 8:45am Long Trade @ 2 (up red arrow)
Buy @ 1.2932
S/L @ 1.2912
TP @ 1.2977
I will keep updating this post with a new print screen as we make the next swings…
10:30am S/L Now @ 1.2926 (-6pips)
Note that RSI is reaching over-bought territory. I am watching closely for an earlier close if needed
10:35 S/L @ B/E
First Trade Closed @ +22pips 

Whilst my ultimate aim is for the end of the move (any point between 5-9), this week I am testing different approaches to profit taking:
(1) Fib extensions
(2) RSI Divergence
all with candlesticks confirmations of course.
As I move along my goal will be to keep the trades open (e.g. the above trade was already in B/E -freerolling), as I move along the swings, until we reach point “5”, then onwards I would be closing out trades.
However, for now, we will be in-and-out since it is my “first week live” with this very short term strategy…
T2: Bought the 38.2% Fib with 0.25% (half of our initial win trade): -5pips (0.25%)
Bought @ 1.2948
S/L @ 1.2938 (10pips)
TP @ 1.2983 (35pips)
GBPUSD 4H CHART: SHORT: S/L Now @+107pips (1.28325)
After picking up some pips in the 5m chart, I am now going with the major timeframe. The Day chart and 4H/2H charts have shown signs of now moving south
Bouncing of the 38.2% fib and Past Support turned Resistance (Day Chart)
SOLD @ 1.2940
S/L @ 1.2970 (30pips)
TP Open

how good is ur system in financial metrics like shart and sortio ratios?
Sorry Win, not quite sure your question. And, I do not have a “system”. I trade the old fashion mechanical/manual tech analysis style. Candlesticks, fibs, trend lines and Swings including a bit of swing analysis…
TUE22SEP20: 5M CHART SHORT GBP/USD: TP Hit +30pips
SOLD @ 1.2816
S/L @ 1.2826 (-10pips)
TP @ 1.2796 (+30pips)

Short GBPUSD 5m Chart: Closed @ +40pips
I have added another trade to our long term short, whilst our 5m trade hit its original TP (+30pips) I am keeping part of it open.
Now I entered another lot

SOLD @ 1.2786
S/L (of both 5m trades) @ 1.2802
TP @ Open
Wed23Sep20 10:00am
GBP/USD LONG - 2H Chart
BOUGHT @ 1.2747
S/L @ 1.2707 (-40pips)
TP @ 1.2890(+143pips)
Note: The proper entry was at 2:30am this morning @ 1.2722 after a 2h harami was formed tesing the 2h hammer. We have divergence showing in all intraday timeframes around this juncture.
Noting that we are still “bearish” bias, so I am keeping a close eye on this one.

**WED23SEP20 16:30 **
GBP/USD LONG 15M CHART
BOUGHT @ 1.2696
S/L @ 1.2676 (-20pips)
TP @ 1.2756 (+60pips)

**THU24SEP20 9:30 **
GBP/USD LONG 2H CHART
After Divergence, Break of Trend Line and Retracement to a 61.8% Fib, I am long at:
BOUGHT @ 1.2720
S/L @ 1.2690 (-30pips)
TP @ OPEN

24SEP20: GBP/JPY LONG GARTLEY62 4H

BOUGHT @ 134.00
S/L @ 133.50 (-50pips)
TP @ 135.50 (+150) / OPEN
Finally, I have the time to scan thru a number of instruments. Currently, I have 6 selected Currency pairs and about 8 commodities. I have found a few “Gartley” formations, some which I missed and others that just formed. Reason for having 8 open positions currently. I am listing them on below
You will notice the repeated 5-step pattern. We entered on completion of Step 5 UNLESS, I want to attempt trading from Step 3 because there is another technical reason to support the move, in our case will be a Major Day Support / Resistance. You will see in the upcoming posts.
GBP/JPY:
Full Gartley Fib62 completed:
Step1: RSI Divergence after a reasonably long downtrend
Step2: Bear Candlestick patterns formed on or around the last downtrend low
Step3: Market took the Down Trend Line
Step4: Market took the last high or in other words, made a New Higher High (on the other side of the trend line)
Step 5: Market retraced to a Fib level (in this case 62%) and formed a Bull Candle Signal (Engulfing)
=> Buy.

24SEP20: USD/CAD SHORT GARTLEY FORMING?
I got to admit, I went short on USD/CAD based simply on the RSI and because I saw Bullish signs on the GBP/USD. However, the USD/CAD can potentially be forming a Bear Gartley in the Intraday charts. It has already completed 4 out of 5 steps.
So, you might have a chance to enter short at Step 5 which I project to be around the 62% - 79% fibs 1.3380-1.34 area.

24SEP20: SUGAR BEAR GARTLEY 79 SHORT
Sugar has completed a nice gartley in the Day Chart with exception of Step 5 “candle signal”, which can be found in the Intraday Charts
Although I entered last night, the market has moved against it, so you will be able to pick up a much better price.
Furthermore, it is forming another Bear Gartley in the Intraday Charts to boot.
SOLD @ 12.63
S/L @ 12.99 (-36PTS) or 13.21 (Swing High)
TP @ 10.87 (+175PTS)

25SEP20: COFFEE GARTLEY STEP3 LONG INTRADAY
I have jumped in on coffee to get a head start on the Day Bear Gartley (Step 4 to 5 Leg or A-D Leg) Meanwhile, it is in the process of forming an Intraday Bull Gartley (currently completd 3 steps)
But once again, after completing the first 3 steps of the Intraday Bull Gartley, I also have a Major Day Support Level to prompt my entry.
A safer trade is to wait for the 4H Bull Gartley to complete its 5 steps before going long.


