I’ve been down my own ML/AI road! It’s fun and it’s frustrating. Ultimately, it’s doomed to fail. I don’t mean to be a downer here, but there are several fundamental principles that streaming market data violate when trying to apply ML techniques.
The first is that there are no Markovian paths in the market. The market doesn’t have rules based on any set, subset or superset of indicators, hours of the day, twitter sentiments, phases of the moon, … whatever. Just because we come up with some great set of inputs for a model, doesn’t mean the market used them for predicting the next leg of price movement. Even though we can create tens, hundreds, thousands of inputs, none of them are related to the NEXT candle from the market.
If you happen to have a model that looks profitable, it can’t be (not WON’T be, but CAN’T be) for very long. You might have over-optimized a local maxima, but it’ll disappear soon enough. Any given “market” is really a collection of agents, and each agent’s motivations change over time. Long-term HODL’s mixed with short-term high frequency traders. Large institutional accounts mixed with a zillion retail traders. And everyone has a different set of input factors for their own wetware, which is never a stable process due to human emotions. (How many times have you changed your system? Now multiply that by all traders playing in the same market as you. Now multiply THAT by the average trader lifetime who exits with a blown account, only to be replaced with a novice trader and fresh cash.) Classic ML, including NN, requires stable underlying processes. Reinforcement Learning can work with slowly changing ones. Neither condition exists in the markets.
AI and ML seem very appealing. But all ML relies on fundamental relationships connecting inputs to outputs. There are no rules in trading (no physics, no engineering boundaries, no code base, no statistical correlations) so any model that is temporarily successful is not successful for long.
I agree with @NomadTodd it can be a promising road
or a road to nowhere.
In June-July of last year I trialled a neural-network
‘genetic programming’ platform, StrategyQuantPro
(https://strategyquant.com/), and for the trial month
I ran hundreds of tests, mostly on forex pairs.
I tried lots of combinations of indicators/time-frames,
and it all looked promising even on MonteCarlo, that is,
until I ran the Random Walk testing, which basically
showed that even the systems with the best Profit Factor or Sharpe Ratio would fall apart in a live scenario.
I tried so many backtests as well as the “genetic” side of the platform’s powerhouse but it all amounted to a lot of thin air. The advice is to take a strategy via MT4 and link it to a real-time demo/live account for forward testing, but Ifelt that if the backtested results fell apart on Random Walk/robustness tests, there was very little chance that they would be optimal for live trading.
Another problem could have been that Iwas testing this on forex, whereas I should have tested it on indices, but these were not available on the free trial. I think with a more trend-based instrument there may have been better results. I set the bar quite high as my chosen test period included the great financial crisis (2008-2009): some of the better strategies I found were able to stay flat during the worst weeks of that period, which in itself was incredible as most strategies completely collapsed into heavy losses on the backtesting. However, Random Walks on those seemingly robust strategies revealed that they relied too much on the predictability of backtesting a strong-trending time-period, thus exposing their weakness as unable to shoulder the unpredictable nature of future price scenarios.
I think the main misunderstanding is that I do not state, that market is ruled by indicators. I believe, that indicators reflect current state of the market from various perspectives (by being usually just an alteration of price). It’s not that market “uses” indicators - it paints them. So I am not trying to unravel the rules governing the market moves What I want to find, is a way to react on what is happening (or already happened) in the market. There is slight difference here between predicting the price movement and training a decision making model.
If it would be true, that prediction of the market is downright impossible due to lack of any “rules”, wouldn’t it mean that traders cannot have profitable strategies? I assume, that profitable strategies exist (either manual or automated). Therefore, there are some “functions” for a statistical edge in the market. Other thing is, that I am not trying to find one network or “optimization” I am looking for multiple different networks, which will activate in different market environments (ie. use different weights and biases for the same indicators).
Am I sure this will work? Definitely not My “stop loss” for this project is that at least I will learn something and practice python.
I tend to not listen, if I hear someone say “doomed to fail” or “impossible” or “too complex” or “I’ve tried and failed, so it cannot work” - especially in the internet.
You are right to try
but optimism is always
better served by the cautious notes
of those who say not that ‘because it
is difficult it is impossible’ but that
(like me) it is not as easy as marketeers
would like newbies to believe.
Thankfully you are not a marketeer
but a genuine person who is
sharing their trials.
Yes, there is predictability in markets,
of course, but I think systems (unlike humans)
may be very good at one thing but not at looking
at the wider picture. Portfolio managers in funds
running multiple automated strategies are human
because it is they who need to oversee the overall
efficiency of systems under certain conditions.
Discretionary traders have more control on every
step, therefore they can ultimately decide if taking
a trade feels right or not. A machine cannot “feel”
the market unless it has data. A trader can hear
the news on earnings and not take a trade, which
means that predictability is not entirely driven
by patterns. The ability of a machine to react to
price is an interesting concept, and I am intrigued.
What InvestiQuant and StrategyQuant have done
is to make off-the-shelf, out-of-the-box backtesting
software that can be used by non-programmers.
The problem with these is that you are relying
on pre-made strings of code that cannot be tweaked
(unless you can code yourself). My comments relate
to this side of using readymade platforms, therefore
what you are doing is entirely different.
I get it. I really do. I’m not saying YOU are doomed to failure, merely that ML requires some correlation between inputs and outputs. There aren’t any in the markets. It will pass any test for randomness. ML models are created specifically for prediction. If you happen to find a profitable model, it’s a coincidence, not a prediction. And the moment a trained model is implemented, it’s out of date because market agents change from tick to tick.
I’m only trying to share a few scars I’ve earned over the years. No need to pay attention to me.
And, like you, studying ML for the markets motivated me to take a deep dive into data science. My programming skills improved, the number of ML model types I learned was incredible, and I simply had a lot of fun trying to get them implemented.
This is open debate. You can find papers with empirical research proving one or the other in different circumstances I would not throw absolutes so easily without any facts attached. And with all due respect to your scars in the market, I still believe you are sharing just your opinion, not facts. https://www.ecb.europa.eu/pub/pdf/scpwps/ecbwp088.pdf this ECB paper nicely explains why it is very hard to beat random walk, yet rejects the random walk for major currencies on longer periods. It’s not that we have the knowledge about what is The Truth. There is team “technical analysis”, which believes in getting some edge on the market and there is team “random walk”, which believes that current state of market carries zero information on how future state may look like. Team “technical analysis” is a generalization and includes also trend following.
I am on “technical” team. For me existence of some very successful traders is sufficient proof for edges on the market. If there is an edge - there is a function for it (no matter how complex).
And thank you for keeping the thread alive Recently I have a lot of personal matters and waiting to put together some tests with over 500 networks.
It took me some time to come up with another update.
Code is getting fatter, as I am adding excel exports, statistics, trade database and many other “features”. I’ve changed the way I’m measuring fitness of given network. New formula is:
First part of equation shows, if expectancy is profitable and then it’s factored by MaxDrawDown to have also the risk side included. So maximizing this number gives the most profitable strategies with lowest account drawdowns. I’m saving all networks which have fitness >5 and then I followup with manual review in Excel. It looks like this:
strategy = code for strategy used, short strategy name (MULTI INDI) + networks threshold to trigger trade (60%) and is the strategy long or short (1/-1)
rsq = r squared to measure how well given network fits to linear account increase. I want the equity curve to be straight as possible (all trades are with fixed position size)
winrate = self explanatory
expectancy = measured like in fitness formula above but without dividing by max dd
dd weighted expectancy = fitness formula from above
avg gain per trade = self explanatory
mdd recovery rate = how many trades on average I need to get up from max draw down. Below 10 is very good.
mdd gain ratio = how many max draw downs fits in result - probably overlapping with other metrics and not very valuable
I’m looking for high fitness, high R-Squared networks to put them together. Once I find few of these, I export nice chart to see the equity curve. Below example for number 1 strategy from the list so far.
Cumsum is cumulated sum of pips.
It does not include dates, as trade frequency is a luxury at the moment. This short network completely ignored period between Q3 2018 and Q1 2021 and trades very rarely overall. What is interesting, is that in 99.9% of cases trades are closed on the next candle. I’ve seen only few trades open for more than one day, despite network having full freedom to close when it wants. Maybe this is a lesson in risk management?
Below one of worst profitable strategies - despite being profitable in the end, it has only Rsquared = 63% which means, that profitability is not well (smoothly) distributed. There was extra market environment for this network between 10th-20th trade when it made >65% of overall result. Not good for live trading.
I’m thinking about switching the fitness criterion to 10 instead of 5 to keep really the best ones.
It is now game of patience - it took 2,000,000 networks created to produce seven with score >10
Next steps:
produce more networks with good stats (for long and short sides)
run through other pairs to check, if these are pair specific. If network will give good results on 15years data for at least two pairs - it is something.
run testing for all combinations of networks to come up with good set (high profitability with little or no max dd increase + increased frequency of trades
demo trade (can’t believe this is on the list already)
I’ve changed criteria to keep the network to be Fitness Function > 1 and R-Squared > 85%. There were some good networks, which were below 5-10 Fitness. After some thought, I am more interested in smooth profit increase, as Fitness > 1 gives enough profitability confidence.
Additionally, I’ve created new strategy with only EMAs (9,13,21,50,100,150,200).
With this I’ve generated > 600 acceptable networks (in comparison to 7 in previous post )
I’ve selected 20 best of them manually, as it is hard to quickly come up with automated logic.
Below is the list of best networks and result chart from combined run.
I like how combining multiple different networks adds to trading frequency and minimize drawdowns just as expected. There is trade almost every month and in worst times all strategies go quite flat together.
I still need to code few functionalities - right now it’s very hard to run simulations for combined networks and overall run/store for other pairs than initially trained. From development perspective networks, strategies, results, statistics and traders are very prone to coupling. It was hard for me at the beginning to clearly lay out the relations between them and now I’m paying price by wasting time untangling the code
What charting software did you use to show those trades? I’d like to visualise what mine is doing, but don’t have time to mess about with excel to do it right now.
I mean the candlestick chart in the post I replied to. Was that a backtest run in a trading environment, or is there somewhere you can plug data to create a candlestick chart with arrows easily?
It’s pretty straight forward to use. It has a function for handling OCHL data.
“”"
fig = go.Figure(data=[go.Candlestick(x=self.data[‘Open_time’],
open=self.data[‘Open’],
high=self.data[‘High’],
low=self.data[‘Low’],
close=self.data[‘Close’])],
layout=dict(
title=title,
yaxis_title=‘Price’))
fig.show()
“”"
Hi! I am starting learning this topic, I have a question, how do you calculate Maximum Drawdown? I’ve been searching everywhere but haven’t found a clear answer.
 What I want to find, is a way to react on what is happening (or already happened) in the market. There is slight difference here between predicting the price movement and training a decision making model.
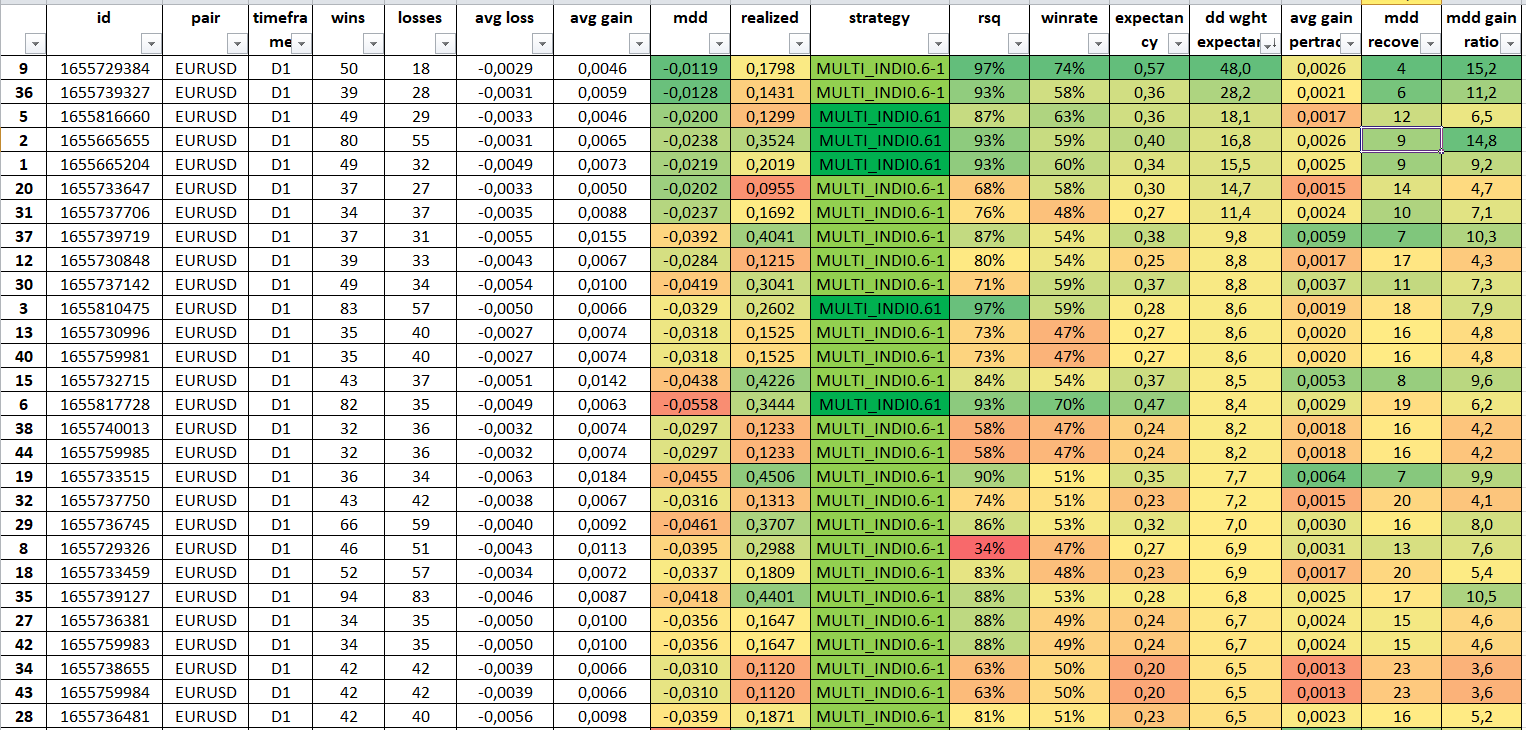


 )
)

