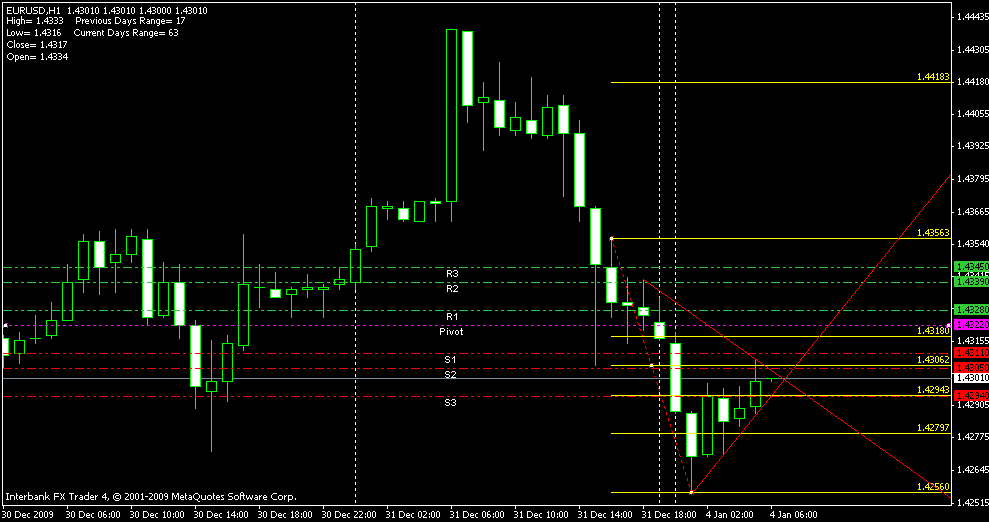
Most Likely my last trade for the year. I wish you all a very peaceful and pipfull new year ahead 
Regards,
Muthu.
Chennai.
India.
Most Likely my last trade for the year. I wish you all a very peaceful and pipfull new year ahead 
Regards,
Muthu.
Chennai.
India.
anyone else use this technique?
Yes, I use a slightly modified version of this technique to measure momentum during the 1st few hours of the day European time/London time sometimes using these trendlines, sometimes using the overnight high and low.
Nice to see you around again SM thought youd permanently gone over to the dark side (Army docs thread).  Took a long hard look at it over three days but decided although good the parameters are just too wide for my style of trading. Hope to see you on the ‘other’ thread.
Hehe - Ichimoku is something I occasionally look at but I don’t actively trade it 

The brief break of the upper trend line on the entry candle on the upside was not taken because it was too close to S1 and the pending order above it was not triggered. Moreover, price was struggling to get past the big number, number of times both through the last hour of candle entry and the hour of entry candle. The short entry at the break of the lower trend line also was crossing and breaking S3 giving a good entry point just below S3 and exited at the thick horizontal line.
Regards,
Muthu.
Chennai.
India.
I am looking for breakouts starting around 8:00am London time. Took 30 quick pips out of the GBP/USD. The EU broke my trendline also but I was busy looking at the GU.
I need to learn about pivot points. I’m wondering where they would fall on this chart.
Hi Muthu,
do you use any indicator for R1 , R2 , S1 , S2 and pivot point or you draw them manually ?
Hi,
I use a custom indicator named “Pivot Lines Timezone” that draws them for me on the charts. Its not manual.
Regards,
Muthu.
Chennai.
India.
Thanks …
Let me try googling it.
If possible you can attach it here …
Cheers 
Hi,
I tried to attach it directly, it wont let me do so.
Regards,
Muthu.
Chennai.
India.
Hi I sent you a mail. Kindly send the indicator .
thanks a ton
cheers !!
Kanak
Is this char correct for Jan 4, 2010. I made 60 pips on this. I have marked the entry point on the chart.
Let me know as m a newbie and corrections most appreciated.
I am trading on GMT 0500 to GMT 0900.
Muthu, could you explain me how did you draw the trend lines for this chart and which are the 5 candles that you are considering?
Check your email
Hi,
I am not trading exactly by the text book (See the first page of this thread). I am experimenting the early breakouts that is happening before Euro open. I consider candles from 0000 to 0500 (or sometimes up to 0600) draw trend lines connecting highs and lows of these candles in question to previous day’s recent swing highs and lows. I use fib levels and Pivot S & R levels for possible target areas. There is nothing dramatic in this, just plain and simple. I am not able to trade Cable as much as i would like as i have to get ready for work around its open. However, if there is enough momentum in the market for Cable say an hour before euro open, i would like to make use of it as well. The expert trader who introduced this method has given a clear explanation in the first page. So that is the bible, i am just trying to work around, trying to tweak it a bit with his permission 
All times are in GMT, I use IBFX
Regards,
Muthu.
Chennai.
India.
Thanks Muthu.
Always Welcome !!
Daily S&R lines are most accurate when calculated by oneself.
Reason:
Broker charts do not show globally accepted FOREX day times.
Because of it 1d candle is misleading
Most accurate chart is 1h with it’s 24 candles.
FOREX day is from 5pm EST until close 4pm EST 1h candle and [B]not[/B] 00:00 AM EST until close 11pm EST 1h candle.
You calculate daily S&R lines once Sun-Thu after 5pm EST close.
Exception is Fri because it incorporates Sat and Sun until 4pm EST 1h candle close.