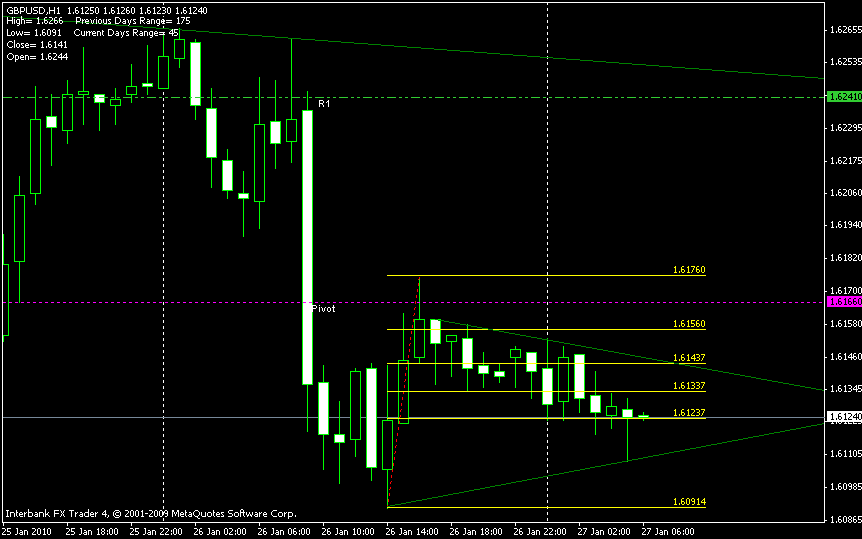
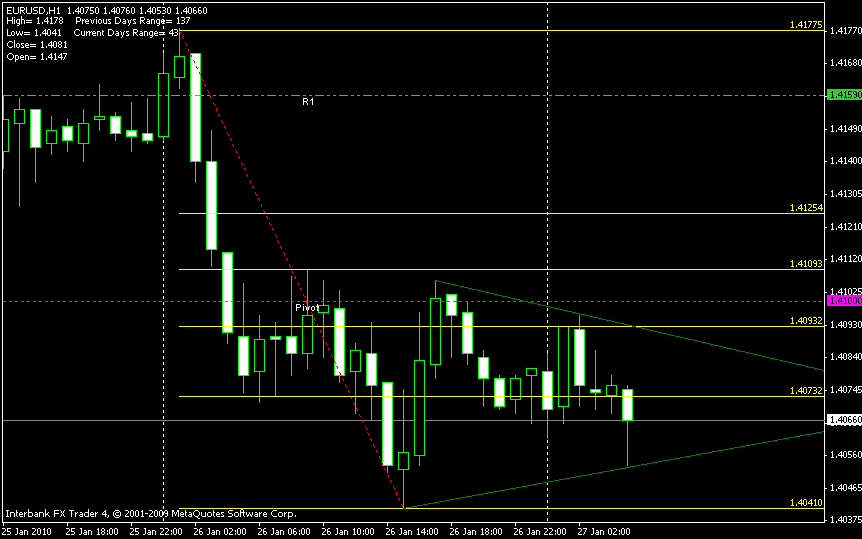
It does seem like it muthu, that is after all a proper trendline, not just the overnight swing high/low trendline.
However, if you include that in the strat, you also need to include SR.
Momentum moves have a habit of breaking strongly through SR and trendlines. Too many things to look at and you’d never take a trade 
At fib level showing 1.62115 which happened to be below both the trigger candle and the previous one.
I have the following high trendline though, I could have also taken the high from the 22nd. I am using Tokyo start times though (not strictly the rules  - feel free to disagree)
Thank you SanMiguel. Appreciate your comment. Looks like i need to zoom out in future to see for such trendlines as well.
Muthu.
Quote from page 1
[B]"With those 5 candles look for valid swing high and swing low of the price.
Draw a downtrend trend line connecting a found swing high to the most recent swing high of the previous days (make sure the last one is a valid high to draw a downtrend trend line through it).[/B]
The writer stresses on the word DOWNTREND in meaning. Does it mean he only considers a trendline whose shape is
\
From the most recent swing high of yesterday to swing high of today’s candle ???
[B]""Do the same for a swing low: connect it to the most recent swing low of the previous days, make sure you are putting in the right trend line using the rules of drawing uptrend trend lines.
[/B]
Now the writer’s emphasis is more on word UPTREND in meaning. Does it mean he only considers a trendline whose shape is
/
From the most recent swing low of yesterday to swing low of today’s candle??
To summarize,
Dost he expect only a shape > for the trendlines and not other shapes say [B]< \ \ / /[/B]
[B]“A protective stop is placed just above/ below the candle that broke the trend line.”[/B]
As pointed out by a reader the candle is never done when it breaks the trendline. So how do we place a stop below an evolving candle ?
I am sorry if these questions sound dumb but if it clears some doubts which i got as i re read the first page few minutes back (ofcourse after a long time), it will only help to improve our trades.
Regards,
Muthu.
P.S. I am not a native speaker of English Language so please excuse my ignorance in understanding 
answers in bold above.
[B]redid my down trendline for today (but I use 0000 to 0600GMT or 0700GMT as the overnight period, I always have. Sorry if this is confusing things, just wanted to point out my thoughts on the strat).
The same reason I have the Tokyo range in black lines on my charts. As d-pip said, a little subjective between all of us at the moment?[/B]

Well thank you for doing your trendlines for me. May be we are not doing exactly the same thing but we are moving towards a more workable system i believe by clearing few things. Btw just hopped in to your chat room to say hello to buddies.
Muthu.
Personally, I think it is important to draw any longer term trendline on your charts as that should have priority over the intraday swing high/low trendlines.
I also then use pivot points and the Tokyo range.
Perhaps when I am back on GMT time, we can use one of the chatrooms to look over the trades together?
Yes longer term TL looks effective and we just saw an example today. Chatrooms are a good option. We can do it that way too. Alright then i take leave now. Time to crash its almost 3 am here.
Gn
Muthu.

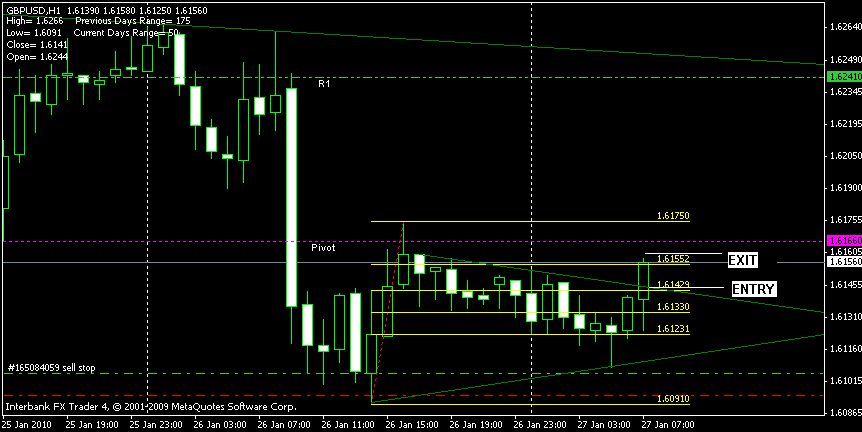
Today’s upper trendline on the Cable is also the top of the range for the Tokyo session. So I am hoping for a break above 1.6160 to go long.

Looks like Price action just broke the down trendline and retraced. Is there anybody that traded the break ?
Muthu.
Yeah I am short now. Pretty good bounce off resistance, we’ll see if it breaks down. PA on the 5 min TF is in a range 6010-6030.
So here is the end result of today, I think I lost 40 pips going short and made 48 pips going long, including spreads. I don’t think I made a mistake, I would have taken that short trade again if the same conditions occurred. There was strong resitance maybe I should have waited for 6093 which would have been the low of the Asian session.
I haven’t traded this today. I can see how some valid trendlines could be used with the 0700 GMT candles on cable but using the Tokyo range, I didn’t draw any DTs for cable.
I did find a valid GBPChf breakout/retrace trade as highlighted below:
Where was your stop for the long?
As cas used to say a strong green candle like that is a signal of strong momentum to the upside.


