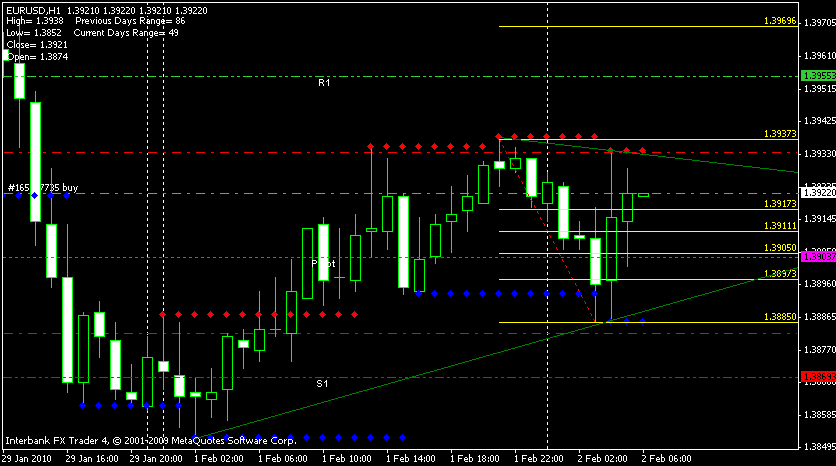
Hi,
Could someone please tell me what timeframes are being used? The original strategy suggests 5 candles starting from 3 hours before London open. I think you guys are using different timeframe. Could you please clarify?
Yes I am trying to make use of Early London breakouts. Most of the time I draw my trendlines at the close of 0500 GMT candle. If you are new to this method, I request you to stick to text book.
Regards,
Muthu.
Hi Muthu, i was wondering if i have the correct times for trading this system. I live in London, so should i draw my trend lines using the 5am to 9am candles and enter the trade as soon as a candle breakes the one of the lines. i noticed in the last trade that you used the midnight to 4 am candles … ?
Hi Dan89:
I take five candles into consideration on most of the days (Most of the days not all) as i try to trade early moves. At 0500 candle close i draw my trendlines. All times are in GMT. I use IBFX which falls in line with GMT. If you are new to the system, just stick to what the first page says. 5am to 9am ? I assume you mean 0500 to 0900 GMT as i believe London is inline with GMT isnt it ? At 0900 candle close if you draw your trendlines, you are past the london open by an hour. London opens at 0800 GMT. So you are missing out on the move if you wait till that time. You might want to try to draw your trendlines at the close of 0700 GMT. Btw the last trade I have connected the 0500 candle. I am off to bed now so i do apologize if you get a delayed reply for any of your questions. See you later on its very late here 0500 local time.
Regards,
Muthu.
Yes GMT is Greenwich Mean Time. Greenwich is in London… theres an actual bronze line in the concrete at the Royal Observatory that marks the spot.
Frankfurt opens at 07:00 GMT (as they are 1 hour ahead of London) and London at 08:00. Interesting to see how people have modified the original strat. 
Hey Muthu,
Is your trend line the same??
Do you still trade the breakout if there isnt a significant downtrend like today?
Thanks in advance…
gbl83
Was able to get +10 pips. Red lines are where i bought and sold. Lucky i got out as price is back under the trend line at the moment.
gbl83
Good Trade.
You will never get BROKE by gaining 10 pips.
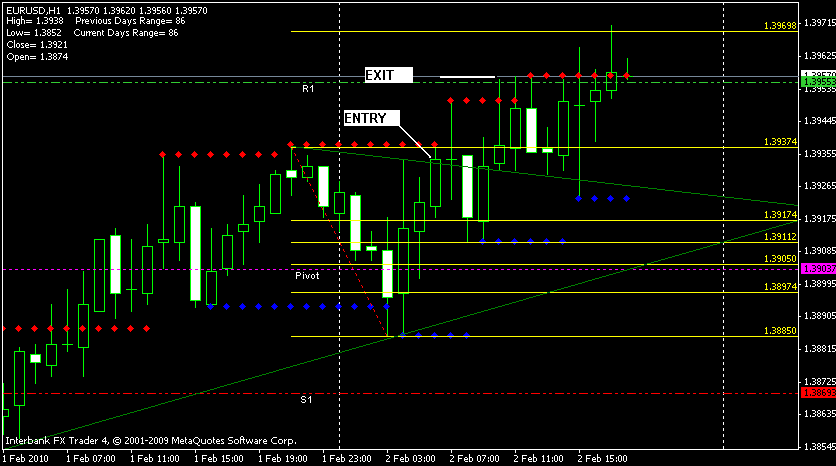
Good exit because you were reaching 50 number ending (Psycological), barrier @ 1.3950 and your Today’s R1 Pivot Points resistence at 1.3955.
Thanks mate. It was my first time trading it live so im happy. Yeah i sold out just below the pivot which i had on another chart. Will have another go tomorrow.
Another possible GBPCHF trade using the Tokyo breakout, retrace method.
Maybe only good for 20pips or so today.

Hi Sorry for the delayed response. I will post my chart now for you to have a look. It does look very similar to yours. I had a power outage today and then left for work. Just coming back to post my charts here. Good to know you won this trade.
Regards,
Muthu.

I just started to experiment with pipholic dots (the red and blue dots) that gives a visible support and resistance levels that i might use to exit a trade should it make a stumbling block before price action hits target area. My target was R1 39553 and price action retraced after hitting the physological 3950 mark that some of you used to get out of the trade. I think it is a mistake to overlook such areas and will keep in mind. Nevertheless trade eventually made its way up after a retrace to reach R1.
Regards,
Muthu.
Chennai.
India.
What time frame is this chart and what broker are you using ? Are they in line with GMT ?
10m but 5 or 15 would suffice. It is a GMT broker yes, GFT.
Thank you. Sent you a PM.
Got distracted and missed the move!
Lesson: do not answer your phone when you want to trade.
This strategy since i have been following has not failed once. Muthu have you had many losses?
gbl83
+25 pips. Cable already made a big move before 08:00 London time so I only looked for EU trades today.
Good job mate


