Losing money and ready to quit? Try this first

Just putting this out there for GOLD traders.
Over the years I noticed that in January most years, Gold has had a decent run up.
The entry is important, because there can be fake-outs that stop you out of your positions before the big run up.

To help overcome this, it might be better to scale in to your position after a strong pullback.

Not suggesting anyone should try this.
But check the MONTHLY chart of XAUUSD over the past dozen years, and you will see it if you drop a vertical line on the chart on 1st January every year.

In 2022, from April to October, each monthly price of Gold has finished LOWER than the previous month.

Then it set up a TRIPLE BOTTOM before commencing its uptrend at end of October, where it has ended 2022 by breaking above the June 2022 resistance.

To sumarise:-

  • Triple bottom to end long down-trend
  • Steady trend higher, finally breaking and closing above significant resistance.

I should mention that with world-wide inflation affecting and weakening currencies everywhere, and the trouble in Ukraine causing uncertainty in markets, it is looking like there could be further upside to the Gold price in 2023.

WEEKLY CHART XAUUSD

Can it match or exceed previous highs?
In August 2020 and March 2022, Gold hit $2070 and $2075 respectively.
Worth noting that this price action set up a double top at the time.
Gold then tumbled $450/oz.
It has put in solid support now at the $1615/oz level.
I hope some of you can trade this current recovery.
Be patient and be happy with small positions. Gold is a fierce commodity to tame.

2 Likes

Pulled the trigger on Oil. Price was rejected at the $86 mark, and not for the first time:

We’ve got a nice downtrend going which is pretty clear on the daily chart:

Looking at Gold, which was recently pointed out by @Ingot54 has blown through that resistance level and shows little signs of slowing. I feel like entering now might be chasing, so I might wait for a bit of a pullback, hopefully a retest of that level, before going in. I’m sure there will be plenty of opportunity.

1 Like

Bad day for Oil, good day for me.

2 Likes

GOLD

I like how this is setting up:

2 Likes

Experienced traders know the effect “Risk-on” and “Risk-off” sentiment has on the markets.
But other factors unknown or not revealed to the markets, can affect the movement in the price of Gold.
I think it was JP Morgan Banking that had more paper scrip short in the market than the entire physical gold supply on the planet during the 2008 - 2011 big price run-up in gold. (USD$720/oz to USD$1920/oz).

How this was allowed by the Chicago Board of Trade or the Federal Reserve, I do not know.
This is what gives the markets the flavour of corruption at times. No doubt JP Morgan Banking was able to explain or deny to the regulator that they held such short positions.

However, they were never held to account for it, and they were able to successfully unwind their shorts without becoming bankrupt, which they almost certainly would have, had they ever been forced to cover their short positions by delivering physical gold metal to those they “borrowed” it from, to create their short positions in the market.
Outrageous.
The price of Gold was predicted speculatively in those years to go as high as USD$50,000.
So traders have Morgans to “thank” that it didn’t reach such levels, despite the wanton and loosely controlled money printing that is now seeding inflation worldwide.

Thanks to Alan Greenspan and Ben Bernanke, who are long gone, and didn’t have to explain their activities to traders, and have never been held to account either.

Which brings us to today’s charts and price movements, that are not explained by news releases.

Try to follow what I have said on these charts, and the news releases, to see if I have erred in thinking this way.
Believe me, when you are watching the news releases and market responses hourly, you don’t miss these things.

Someone said: “The markets can remain irrational longer that you can remain solvent.”
My profits were trimmed in the past 24 hrs, and I remained out of the markets today, since it is Friday when the funny money comes out to play in the markets.

Incidentally, the Canadian and United States employment numbers has been released while I was constructing this post. The news was “good” (green) and should have triggered a sell-off in Gold, since good news needs no hedge. But no, Gold was bought on this good news, rallying from USD$1834 to USD$1852.

That is the exact opposite of what would be expected when good news is announced to the markets.

Go figure!!

1 Like

Yes, very interesting. I went long on a small Gold position last night because I didn’t want to miss the dip, Iand I’m happy I did. Stocks and Gold both up today. Big change to my portfolio over yesterday.

1 Like

Lowering the number of losses that a trader usually suffer is the cardinal challenge faced by every trader.

1 Like

Don’t quit the market rather keep your attempts running. Hopefully, you will be able to derive sufficient amount of profit from the market.

1 Like

I will post this here as well since it qualifies for this strategy:

1 Like

Good call, Matty - more upside on the weekly NZDJPY chart.
Stochastics turning up now, and MACD also turning up from under zero on WEEKLY.
Same with GOLD - strong uptrend - target $2070 … and then some hopefully.

1 Like

I have been getting inquiries about this strategy, asking “Does this strategy still work?”, so I thought I would post an update to bring this thread back to life a bit.

This strategy is timeless, you just need to look for established trends.

You can spot these by making rough channels on the weekly TF. Here’s an example:

Right now it seems this pair is in a pullback stage, so a lot of patience is required for this strategy. The key is to start looking for shorts at the top (in a downtrend) and longs at the bottom (in an uptrend) of these channels.

Use small position sizes and scale in as long as price continues in your direction. And always have a predetermined loss amount in mind just in case it turns around on you.

Good luck!

4 Likes

thanks - very good to see you continuing the thread - it’s all such good advice! :sunglasses:

3 Likes

Another rule I have implemented for myself over the past 6-8 months is the use of a 20MA set to the Daily TF. Here’s why:

I have a history of trying to catch tops and bottoms because I am not a patient person. I have accepted this. To deal with this I found that adding a 20 MA (daily TF) and waiting for price to close over or under it forces patience.

So, waiting for a short here doesn’t only require price to break the previous days’ low, it requires price to also close below the 20MA (20 MA’s actually. I couldn’t decide between the EMA and the SMA, so I chose to use both).

Weekly view:


Daily view:

I’ve implemented the 20MA (daily TF setting) on my main strategy as well because it’s been so effective for me and adds another layer of certainty whether it’s a new trend (price crosses over MA), or an existing trend (price pulls back to MA).

Buy above the 20MA, sell below the 20MA (combined with price action such as the strategy used here). The idea is to have a strategy that’s as mechanical as possible.

1 Like

Might be looking at another push up with USDJPY.
This is the type of setup I look for; a pullback in and uptrend:

You’ll want to wait for that pullback structure on the daily or 4H chart to break:


It will probably go something like this:

Unless the bottom falls out, but that’s why we wait for confirmation before entering.

2 Likes

What pairs do you trade using this strategy?

1 Like

What do you use as confirmation? The bottom line being respected as support?

1 Like

Any pairs that have an obvious trend on the weekly/monthly charts.

You can use a number of different methods to confirm an uptrend. One way is to wait for price to make a HH, HL, HH, then another HL on a smaller TF like the 1 or 4H. Or, you can set a buy order at the H of the daily candle each day and wait for price to break out.

Here’s an example of a downtrend turning into an uptrend, using the USDJPY 4H chart from a couple of month ago:

1 Like

Gotcha thanks! So for example your trade on your picture you put a buy order on the previous candle because it made a HL on a smaller TF

Not just a HL, but a series of HL’s that confirm an uptrend.

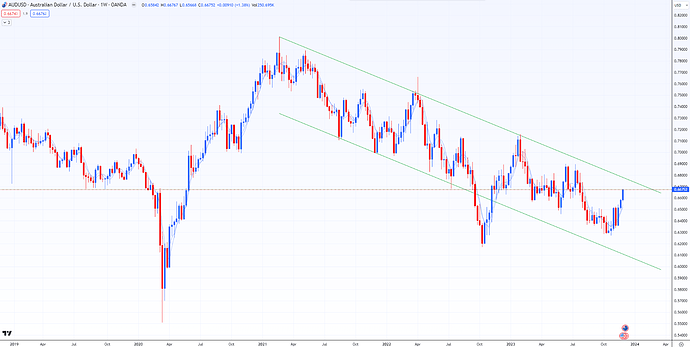
Let’s look at one now, we’ll use AUDUSD, which is in an obvious downtrend on the weekly:


This is a good looking chart because price is sitting in the upper part of this channel. You can enter this 2 ways:

  1. put a sell order at the low of the previous days’ candle.
  2. wait for a downtrend on the lower TF, such as the 4H, or a breakdown of the current uptrend:

    With some patience you can avoid entering too soon, having to sit through a 3 day pullback. Set a wide SL and walk away.
2 Likes