Don’t quit the market rather keep your attempts running. Hopefully, you will be able to derive sufficient amount of profit from the market.
I will post this here as well since it qualifies for this strategy:
Good call, Matty - more upside on the weekly NZDJPY chart.
Stochastics turning up now, and MACD also turning up from under zero on WEEKLY.
Same with GOLD - strong uptrend - target $2070 … and then some hopefully.
I have been getting inquiries about this strategy, asking “Does this strategy still work?”, so I thought I would post an update to bring this thread back to life a bit.
This strategy is timeless, you just need to look for established trends.
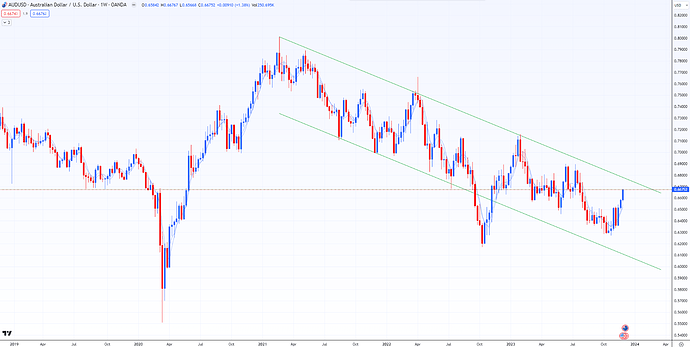
You can spot these by making rough channels on the weekly TF. Here’s an example:
Right now it seems this pair is in a pullback stage, so a lot of patience is required for this strategy. The key is to start looking for shorts at the top (in a downtrend) and longs at the bottom (in an uptrend) of these channels.
Use small position sizes and scale in as long as price continues in your direction. And always have a predetermined loss amount in mind just in case it turns around on you.
Good luck!
thanks - very good to see you continuing the thread - it’s all such good advice! 
Another rule I have implemented for myself over the past 6-8 months is the use of a 20MA set to the Daily TF. Here’s why:
I have a history of trying to catch tops and bottoms because I am not a patient person. I have accepted this. To deal with this I found that adding a 20 MA (daily TF) and waiting for price to close over or under it forces patience.
So, waiting for a short here doesn’t only require price to break the previous days’ low, it requires price to also close below the 20MA (20 MA’s actually. I couldn’t decide between the EMA and the SMA, so I chose to use both).
Weekly view:
Daily view:
I’ve implemented the 20MA (daily TF setting) on my main strategy as well because it’s been so effective for me and adds another layer of certainty whether it’s a new trend (price crosses over MA), or an existing trend (price pulls back to MA).
Buy above the 20MA, sell below the 20MA (combined with price action such as the strategy used here). The idea is to have a strategy that’s as mechanical as possible.
Might be looking at another push up with USDJPY.
This is the type of setup I look for; a pullback in and uptrend:
You’ll want to wait for that pullback structure on the daily or 4H chart to break:
It will probably go something like this:
Unless the bottom falls out, but that’s why we wait for confirmation before entering.
What pairs do you trade using this strategy?
What do you use as confirmation? The bottom line being respected as support?
Any pairs that have an obvious trend on the weekly/monthly charts.
You can use a number of different methods to confirm an uptrend. One way is to wait for price to make a HH, HL, HH, then another HL on a smaller TF like the 1 or 4H. Or, you can set a buy order at the H of the daily candle each day and wait for price to break out.
Here’s an example of a downtrend turning into an uptrend, using the USDJPY 4H chart from a couple of month ago:
Gotcha thanks! So for example your trade on your picture you put a buy order on the previous candle because it made a HL on a smaller TF
Not just a HL, but a series of HL’s that confirm an uptrend.
Let’s look at one now, we’ll use AUDUSD, which is in an obvious downtrend on the weekly:
This is a good looking chart because price is sitting in the upper part of this channel. You can enter this 2 ways:
- put a sell order at the low of the previous days’ candle.
- wait for a downtrend on the lower TF, such as the 4H, or a breakdown of the current uptrend:
With some patience you can avoid entering too soon, having to sit through a 3 day pullback. Set a wide SL and walk away.
Bumping this back up for those who need it. It is still relevant and always will be.
I wanted to bring attention to the post I read today (below), which could be another option for managing trades like these that can run for extended periods:
Chances are no matter where you enter, the position will go against you at some point, and almost always multiple times. So, starting with a position 1/3 or even 1/4 of your preferred size can help control your draw-downs. In the end, if the position goes against you then you’ve still stayed within your risk tolerance. However, if it goes in your favour, entering at different levels (averaging) can actually increase the rewards.
This type of cost averaging strategy is similar to investing, and is viewed by many as “adding to losing positions”. However, when done responsibly, can be rewarding.
Now, without further ado, here are a few more charts for your viewing pleasure:
Silver has been in an uptrend for 2 years, but looks to be in a bit of a consolidation period. How long this will last, who knows, but I will be using the cost averaging strategy in anticipation for a nice move up:
GBPUSD - A picture perfect leg up (in hindsight) with a fake-out to the downside. Too bad I missed it:
USDJPY - Lots going on here. Strong downside, but need to see what happens at that support level:
EURGBP - This one was a heart-breaker. They don’t always work out so be prepared:
GBPNZD - I have 2 open positions here:
Happy trading!


