I found this indicator: Market profile singles (we can also call it a single print indicator or a gap indicator).
You can find it on the mql5 market under the name “market profile singles indicator”. It is in version metatrader 4 and metatrader 5.
This indicator is based on market profile theory. Displays the singles area. ( I’ll copy an article for you here )
What exactly is a singles area?
Theory: Market Profile Singles :
Singles or single prints or gap of the profile are placed in the inside of a profile structure, not at the upper or lower edge.
They are represented with single TPOs printed on the Market profile.
Singles draw our attention to places where the price moved very fast (impulse movements). They leave low volume nodes with liquidity gaps and therefore the market imbalance and show us the area of imbalance.Singles are usually created when the market reacts to unexpected news. It is these reports that are capable of causing extreme imbalances and preparing the spawn for the extreme emotional reactions of buyers and sellers.
The market will want to revisit this area and examine whether these price levels are not traders interested in trading at these prices. Why should these merchants be there? Because the market literally flew through the area and only a small number of traders got a chance to trade there. For that these areas are likely to be filled in the future .
These inefficient moves tend to get filled and we can seek trading opportunities once they get filled or we can also enter before they get filled and use these single prints as targets.
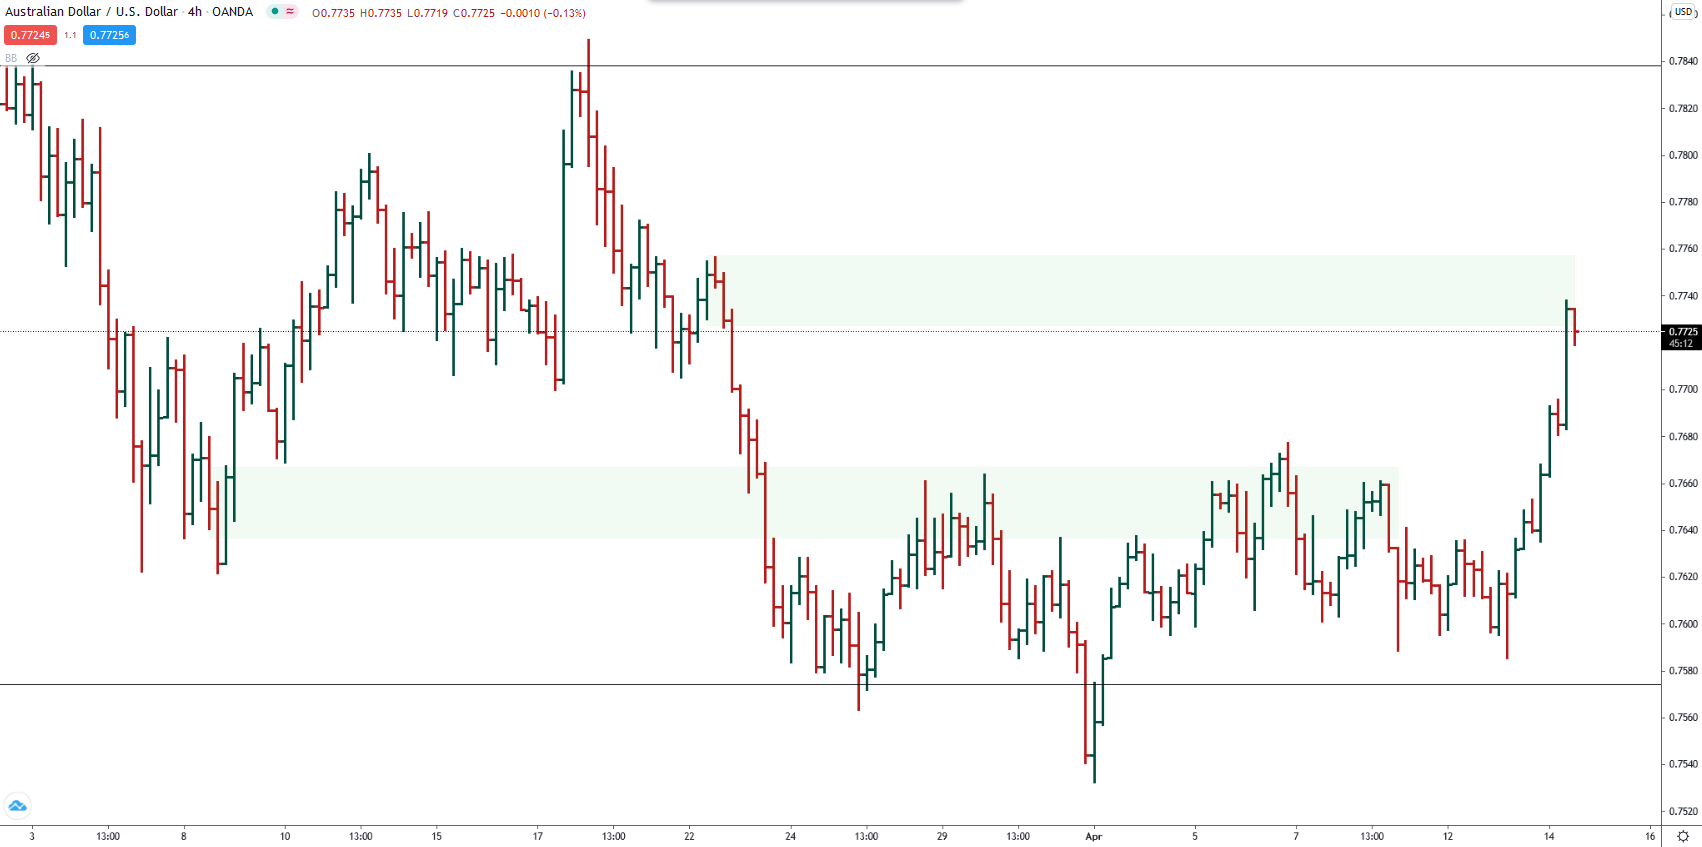
Used as support/resistance zones , but be careful not always.Usually it works very well on trend days . See market profile days: trend day (Strategy 1 - BUY - third picture) and trend day with double distribution (Strategy 1 - SELL- third picture) .
It is good to start the trend day and increase the profit
but Be aware that trend days are only 15 - 20% of the time
Therefore, I mainly recommend strategy 2, which is 75-80% of the time .
These levels are watched by the big boys and the banks. This indicator will show you these levels.
Remember there is more than a 70-80% chance that these areas will be tested in the future. This puts the probability to our side.
Observe money and risk management .Always use a stop loss . RRR minimum 3:1 .Take a risk a maximum of 0.5 - 1% of the account per trade.
I enclose three strategies that I trade myself.
These three strategies are repeated in the market, so it is good to trade all three .
Strategy 1: Trend is your friend
Strategy 2 : Test the nearest level
Strategy 3 : Close singles and continuing the trend
Recommended time frame is M30 and especially strategy 2.
Strategy 1 - BUY :
- A bullish trend has begun
- The singles area has been created
- The prize goes to the side and stays above the singles area
- We buy above the singles area and place the stop loss under the singles area
- We place the target profit either according to the nearest market profile poc or resistance or under the nearest singles area.We try to keep this trade as long as possible because there is a high probability that the trend will continue for more days


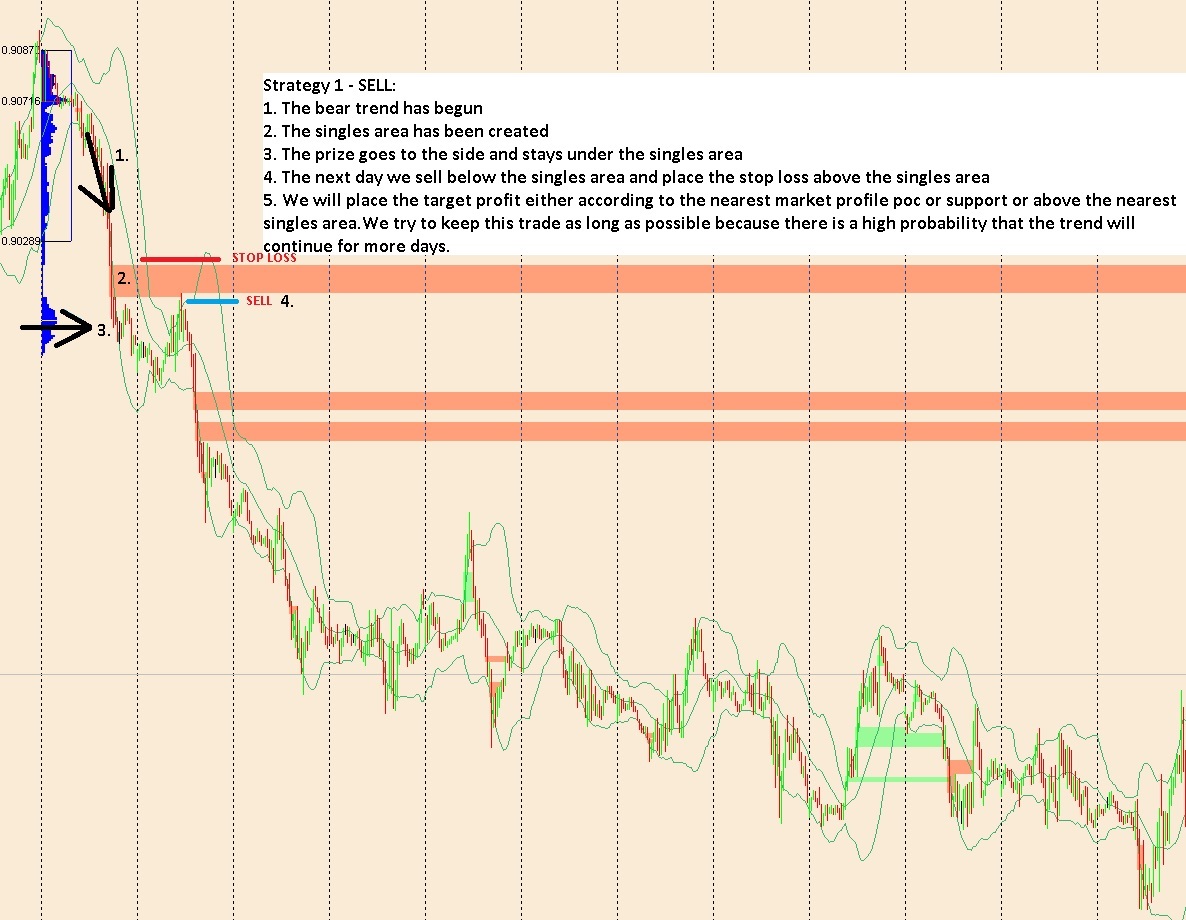
Strategy 1 - SELL :
- The bear trend has begun
- The singles area has been created
- The prize goes to the side and stays under the singles area
- We sell below the singles area and place the stop loss above the singles area
- We will place the target profit either according to the nearest market profile poc or support or above the nearest singles area.We try to keep this trade as long as possible because there is a high probability that the trend will continue for more days.


Before we start strategy 2, we will explain what it is Initial Balance .(IB) is the price range of (usually) of the first two 30 minute columns of session of the Market Profile.
Initial Balance may help define the context of the trading day.
The IBH (Initial Balance High) is also seen as an area of resistance and the IBL (Initial Balance Low) as an area of support until it is broken.
Strategy 2 - one day - BUY:
This strategy will take place on a given day
- There is a singles area near IB. (singles area was created on a given day)
- The price goes sideways or creates a V-shape
- We expect to return to the singles area or IB. We buy low and place the stop loss below the daily low (preferably a little lower) and place the target profit below the IBL (preferably a little lower).


Strategy 2 - one day - SELL:
This strategy will take place on a given day
- There is a singles area near IB. (singles area was created on a given day)
- The price goes sideways or creates a reversed font V
- We expect to return to the singles area or IB. We sell high and place the stop loss above the daily high (preferably a little higher) and place the target profit above the IBH (preferably a little higher).


Strategy 2- more days- BUY:
This strategy lasts more than one day (Singles were created yesterday or more days ago)
- After the trend, the price goes to the side and does not create a new low (or only minimal but with big problems)
- Nearby is a singles area ( Since the price cannot go to one side there is a high probability that these singles will close ).
- We buy at a low and stop loss we place it a bit lower. We will place the target profile under the singles area .


Strategy 2- more days- SELL:
This strategy lasts more than one day (Singles were created yesterday or more days ago)
- After the trend, the price goes to the side and does not create a new high (or only minimal but with big problems)
- Nearby is a singles area ( Since the price cannot go to one side there is a high probability that these singles will close ).
- We sell at a high and stop loss we place it a bit higher. We will place the target profile above the singles area .


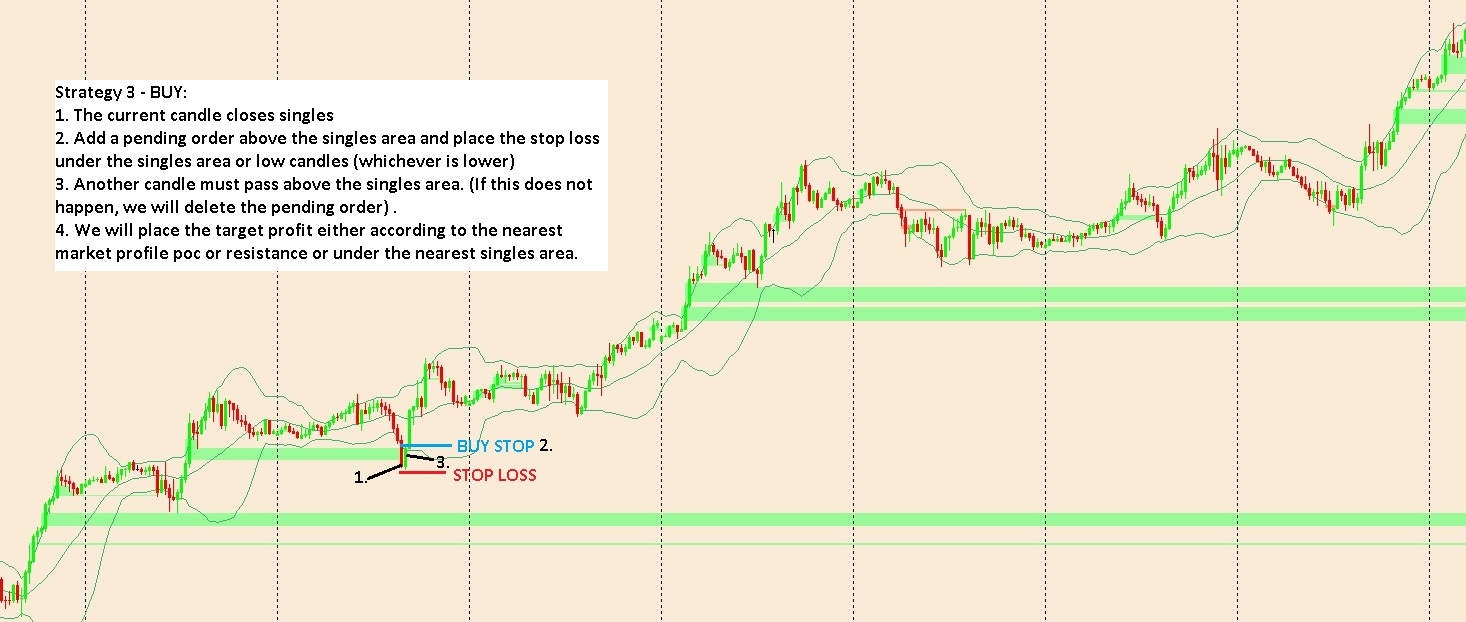
Strategy 3 - BUY:
- The current candle closes singles
- Add a pending order above the singles area and place the stop loss under the singles area or low candles (whichever is lower)
- Another candle must pass above the singles area. (If this does not happen, we will delete the pending order) .
- We will place the target profit either according to the nearest market profile poc or resistance or under the nearest singles area.


Strategy 3 - SELL:
- The current candle closes singles
- Add a pending order under the singles area and place the stop loss above the singles area or high candles (whichever is higher)
- Another candle must pass under the singles area. (If this does not happen, we will delete the pending order) .
- We will place the target profit either according to the nearest market profile poc or support or above the nearest singles area


What do you say to this indicator and these strategies? Well thank you