I wish I held on to this one longer. I was taken out because I moved my SL to BE too soon. I might get back in today though.

You don’t have to find the pair each time, just focus on one or two pairs and keep a track of them. I think I am taking your question in the correct way?
Not the best strategy, trading the 2 weakest currencies. Oh well, it’s slowly moving in my direction:
Oil is projected to rebound this year:
“ After suffering a pandemic-induced demand shock, the oil industry is expected to recover on the back of stronger demand, lower supply and greater clarity around energy policies, according to Goldman Sachs Research “

Possible day trading strategy that I want to test out over the next few weeks. This uses SW formulas similar to Dennis’ Strong Weak thread, but with some significant alterations.
For this strategy I am using the Bollinger Bands 20MA on the daily chart (EOD).
By doing this I am trying to determine the pair furthest away from the MA, indicating a pullback or reversal.
Here are Friday’s numbers:

As you can see, EURAUD & EURCAD are the top two, furthest away from the 20 MA. Let’s take a look at those charts:
EURAUD - Higher low, long-term downtrend, positive inside bar. Nothing too spectacular to signal a pullback, maybe that IB.

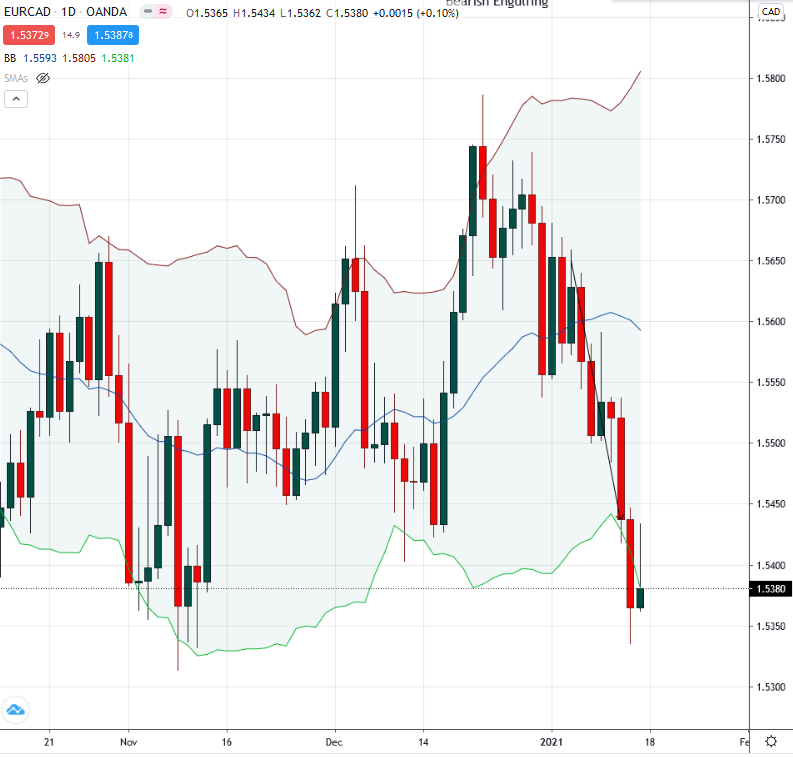
EURCAD - Higher low, current downtrend, long-term ranging, and if you look left there is some previous support. Also, look at that pin-bar on Friday, that can be a signal for a trend reversal or a pullback. I would be long on this pair, according to this strategy.
Let’s see how these 2 pairs finish on Monday.
This pair finished the day positive, which is what I was looking for. H to L was 87 pips:

My 2nd pair finished positive as well, 75 pips from H to L:

Here are the next 2 pairs. Keep in mind I’m not actually trading these, I’m just looking at results. If I was trading them I’d be posting this right around the candle close. We are currently already 7.5 hrs into the NY trading day, so Tuesday’s candles have already partially formed.
I might do away with the Bollinger Bands because what we’re really looking at here is price action, candle formations, and the distance between price and the 20MA.

EURGBP - This definitely looks promising for a pullback. Look to the left and you can see some support. I might even consider trading this pair.

EURCAD - I have my doubts for my #2 pair, it looks like this down trend may have resumed:

Small gain. 35 pips HL

Surprisingly this pair did well with 94 pips HL:

Tomorrow’s pairs are:

GBPNZD short:

And AUDNZD short

More moolah here:

Money here too. I know for a fact because I have 2 positions running. What do you call that, a shooting star, a gravestone doji? Either way, looks pretty bearish to me. Could see a reversal on this pair.

Tomorrow’s pairs:

EURCAD Long - looks promising so far:

EURAUD Long - I hope I’m wrong because I’m currently short on this pair, it’s our top SW trade:


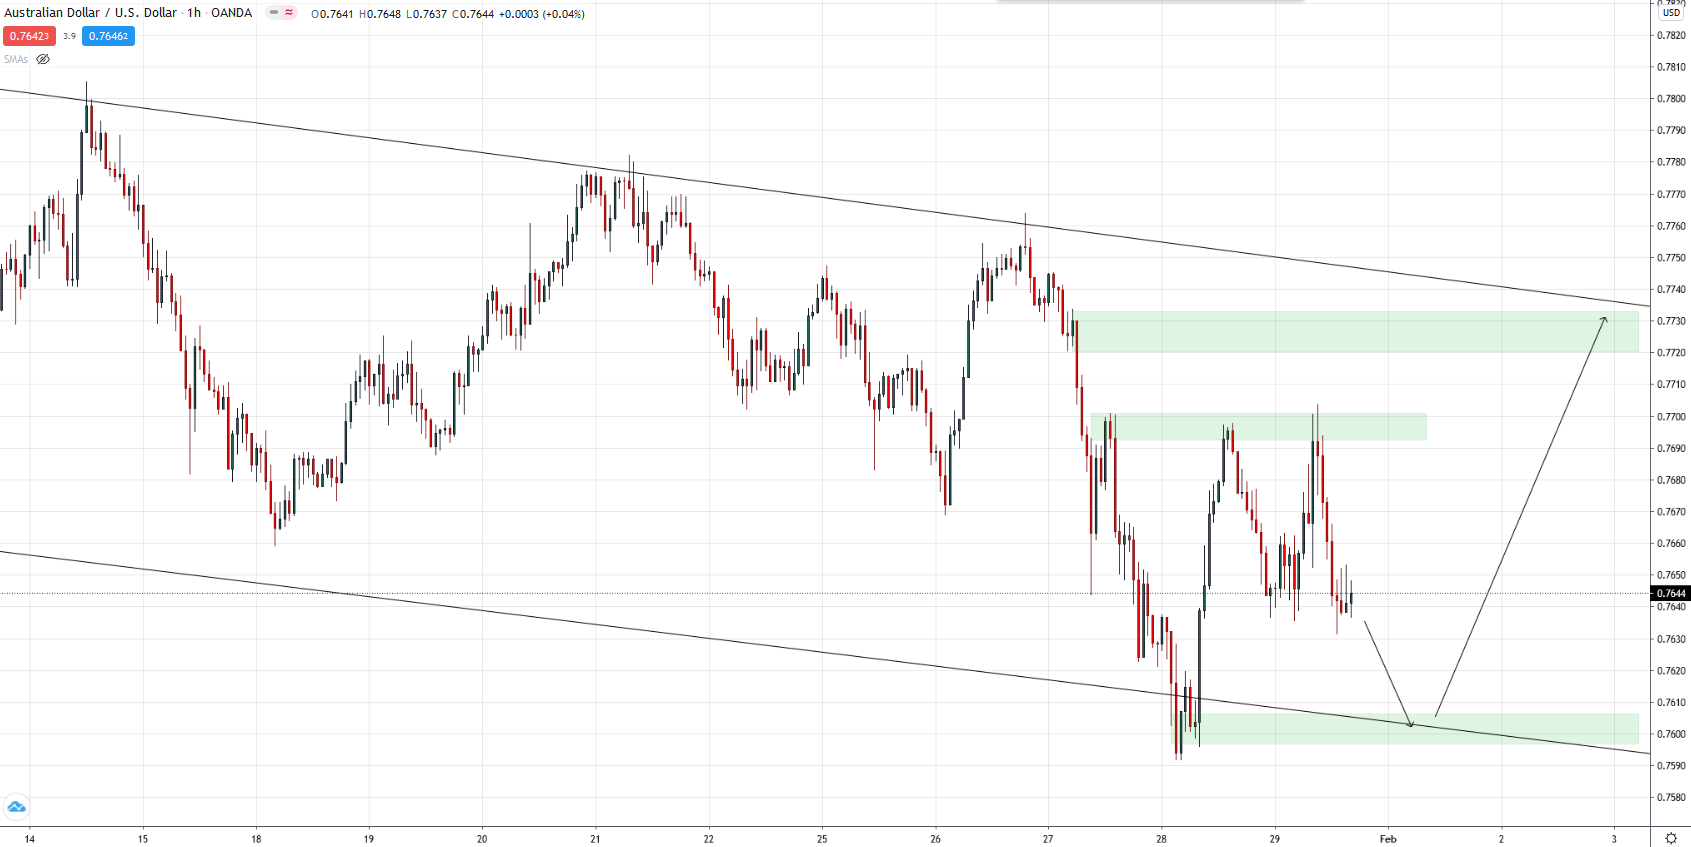
AUDUSD 1H - I will be looking to buy if it hits the green zone:
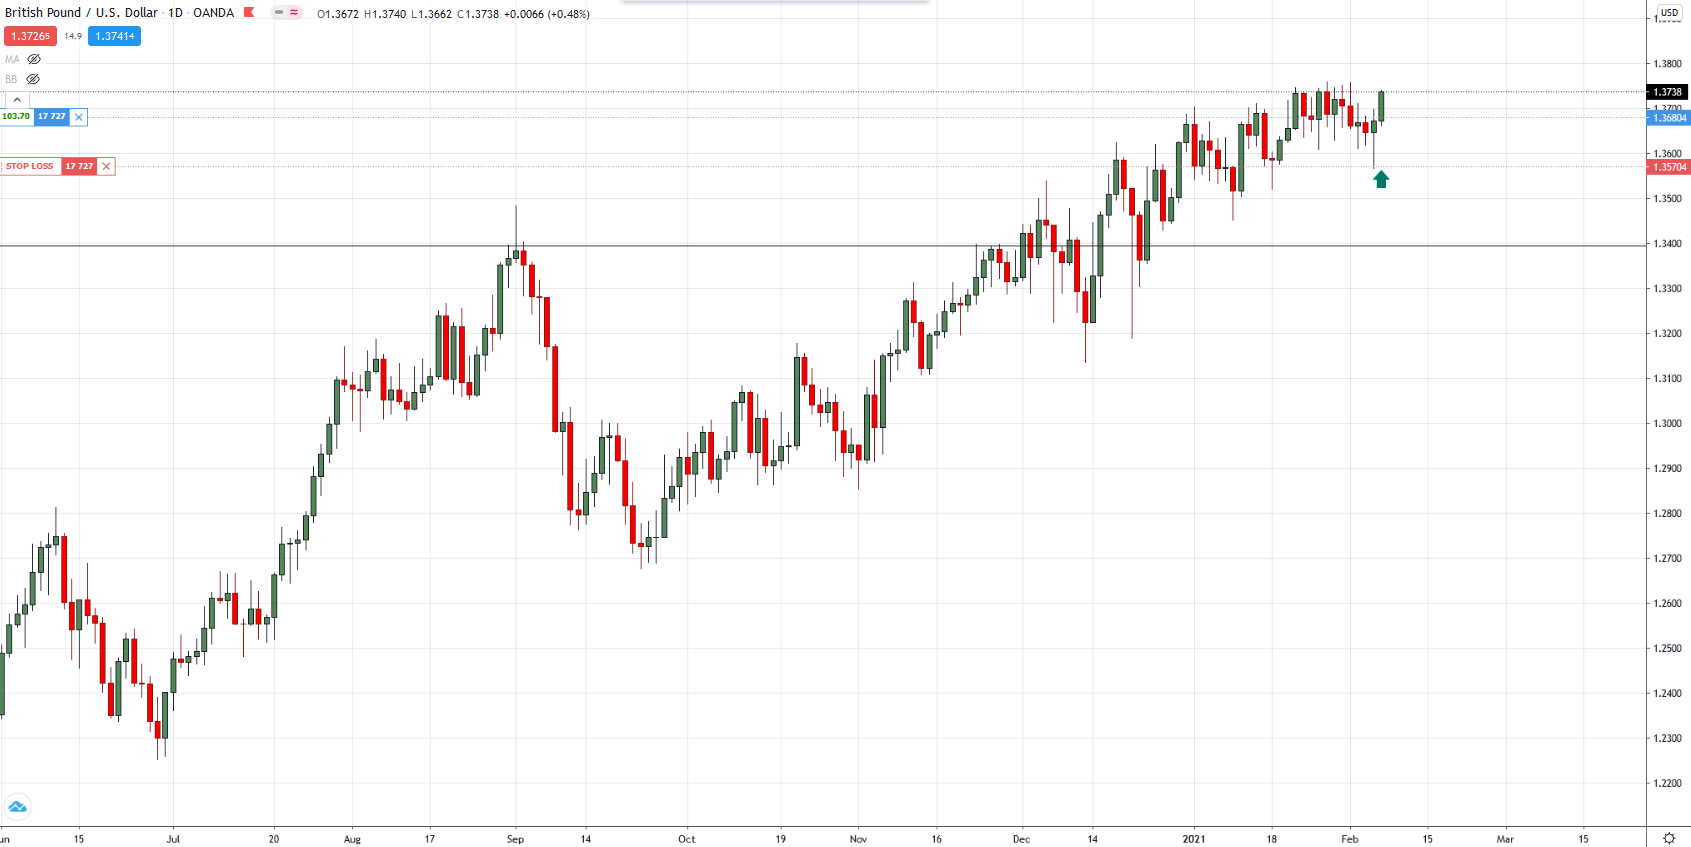
GBPUSD 1H - Price is consolidating. Again, I’m looking to buy if it bounces off the green zone. This would be a continuation of the long-term uptrend. Of course, there’s always the chance of a breakout to the downside. In conclusion, price will either go up, or down, lol. You’re welcome.

AUDJPY 1H - I’m looking for price to fill in the space created by that strong move up. I find this usually happens on shorter time frames.

CADCHF 4H - Lots of upward momentum the 2nd half of Friday. But, momentum rarely carries over to the next week, in fact, it usually starts off going the other way. And as I said earlier, price will likely want to fill in the space created by that strong move:

Looks like it’s risk on this week, which means a strong AUD, CAD, NZD. I’ll personally be looking at Wheat and Gold to rebound as well.
On the opposite side, expect a weak USD, JPY and CHF.

Here’s a cool little short-term (scalping?) strategy that I’ve been using for the past few weeks. I got this idea from another site and modified it to suit me and it’s been pretty effective so far. My main strategy uses daily candles, but on days where there are no trading opportunities I turn to this.
This strategy is based on supply/demand and looks to fill in the “gap” created by a strong candle. the “gap” is just that, the space created to the immediate left and right of the candle, not impeded by a shadow, or wick.
I use the 1 hr TF to find strong, stand-alone candles. It is believed that these candle contain their own supply/demand zones. Whether you chose to believe that or not is up to you, but that’s the idea behind it. I use these areas to mark my target points.
I use buy/sell orders (not market) because you are essentially trying to catch tops and bottoms.
I have marked out a few areas of interest on the AUDUSD 1H chart:

This chart is showing a sell opportunity next week. However, I don’t like trading the first half of Monday, so I’ll wait to see what it looks like later on.
This strategy has been said to work on shorter TF’s as well, like 15 min charts. However, I personally find it more accurate using the 1H TF. But don’t go by me, try it out for yourself on any TF.
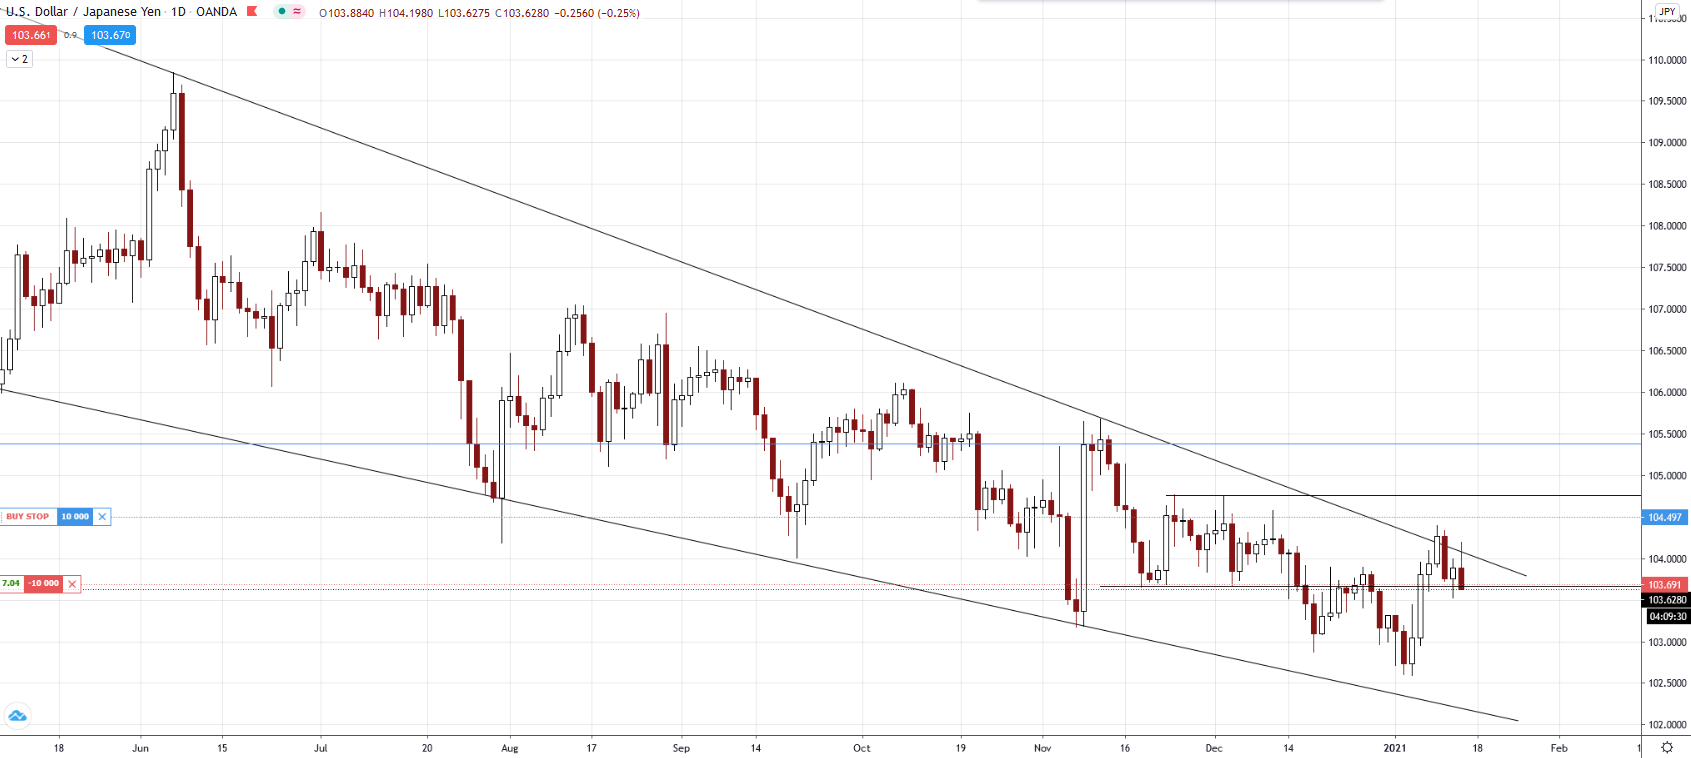
Based from SW ranking’s formula, USD has weakened the last 3 days (see “Change” row):

USDJPY 4h: If USD continues to weaken, I expect this pair break out of this channel toward my personal target of 103.80. This target was determined by my “Gap” strategy above (I used the daily chart instead of 1H for this one):

Friday saw some strong moves, which usually sets us up for a correction, especially if the next trading day is on a Monday (in my experience).
One which is of particular interest to me is NZDUSD where I’m expecting a pullback due to price bouncing off resistance at 0.7315. If we see this move then I will TP and then wait to buy:

This is risky, so alternately you could just sit back and wait for the (potential) correction to be completed. But as you can see my order was already picked up, so I’m in it now.
GBPAUD 2H: Another pair I’m watching. Strong bearish move on Friday.I do expect a correction, but overall I’m bearish on this pair despite the recent strength of the GBP.

Update on this post above regarding my SD, Gap strategy…
Here’s the original chart:

Price continued to climb after my original post. However, it did eventually make its way back down to touch my target zones:

Are we headed back up from here?


