Will Copper be the new Oil?
“*Move over, oil. Copper will soon be the most important commodity in the world, says Nicholas Snowdon, commodities strategist in Goldman Sachs Research. *
*On an episode of the Exchanges at Goldman Sachs podcast, Snowdon argues that because it is “the most cost-effective conductive metal [for] capturing, storing [and] transporting electricity,” copper will be the key metal in the transition to a green economy. *
*He also estimates its price will soar from about $10,000 a ton today to about $15,000 by 2024. Why? Because the copper industry isn’t ready for the coming spike in demand. *
*“There’s no real investment in new mine projects and so, essentially, the copper market is sleepwalking into a really sizeable supply crunch akin to what we saw in the oil market back in the 2000s,” Snowdon says. *
*Ultimately, it will take “incredibly high” copper prices to encourage new investments. “Until there’s a really sharp increase in mine investment and capex goes back to the levels that we saw in the late 2000s—and we’re only about half of that currently—I think we’re a long way from declaring ‘mission accomplished.’ *
And so, I think that’s really the key message: Year one of a multiyear bull market really lies ahead of us.””
1 Like
A nice read indeed! I have bookmarked this thread and will keep visiting it for more exciting information. It is nice that you tried to make use of indicators and I’m actually looking forward to seeing some progress here.
1 Like
Looking at copper (see post above), I wish I had got on this months ago. Look at the weekly chart:
Back off to the 4H, I will be getting in long if this breaks up through that resistance, and with any luck, ride it up for many months.
However, it’s easy to ‘predict’ coppers’ rise AFTER it’s already happened. Had they posted that article a year ago it would be much more impressive.
Waiting for trends to resume, last week I found myself moving away from daily candles and down to 1 & 4H charts, looking at SR & SD zones.
AUDUSD 1H:
Also going to revisit this day trade/scalp strategy I was testing back in January here.
This pullback strategy takes advantage of the SW pairs that pull furthest away from that 20 MA (daily candles). The idea is to grab a few pips on the pullback.
I still have a lot of testing to do with this because I need to figure out how many pips to set my TP without getting greedy, and also where to put my SL. This is a once per day trade as once my TP is hit then there’s no going back in, so it needs to be a decent size position. Very risky strategy, but does have potential.
The pairs will mostly correspond with the typical SW pairs. Here’s Friday’s ranks:

According to these numbers I’ll be looking at going long NZDCHF and grabbing 10-15 pips:
I won’t be trading this strategy on Mondays because trades need to be made 1 hour after NY close, otherwise spreads will take me out immediately.
USDCAD:
Daily view…I know I’m not the only one looking at this:
But I highly doubt it will be that easy, USD has been strong this week.
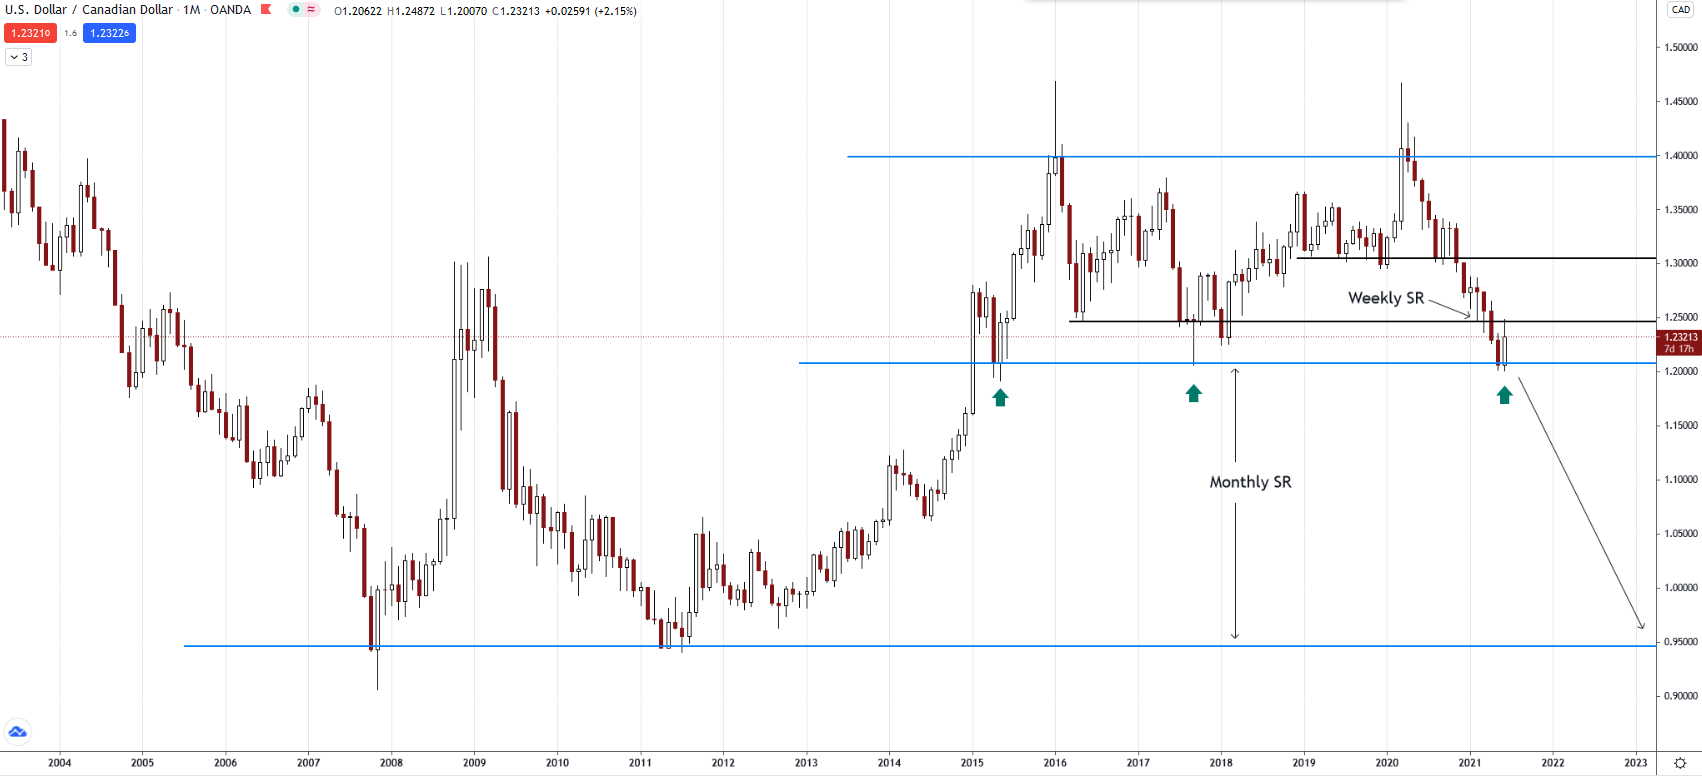
USDCAD Weekly - Things are getting interesting. Price hit a strong, monthly support area for the 3rd time in 6 years, and has now bounced off a weekly S turned R. Let’s see if that R holds:
This could be a good sign that price is headed down. Quite possible down to the next S area at 0.95. Here’s the monthly chart:
1 Like
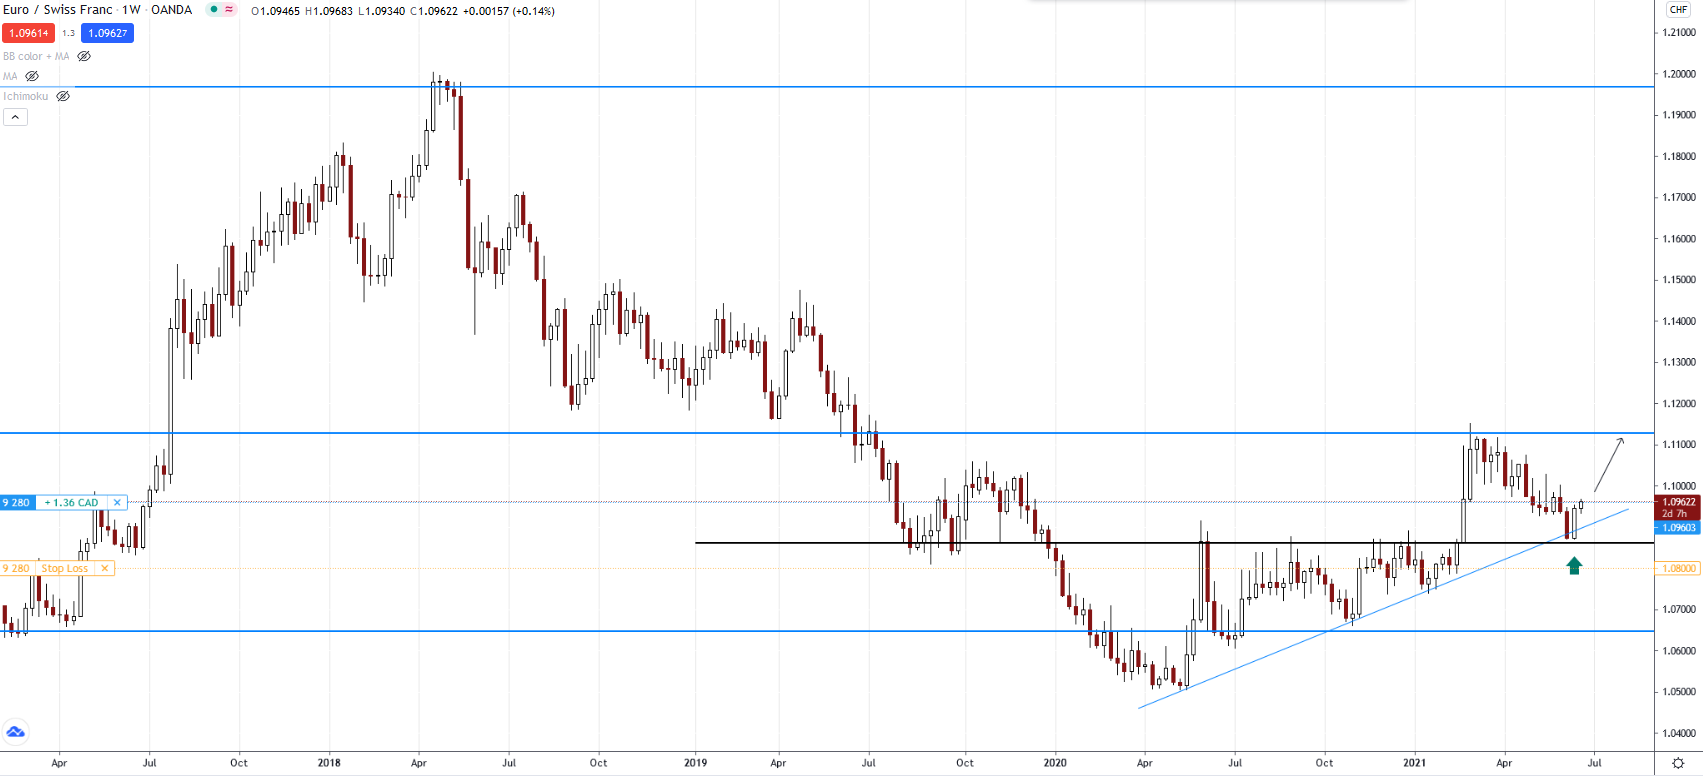
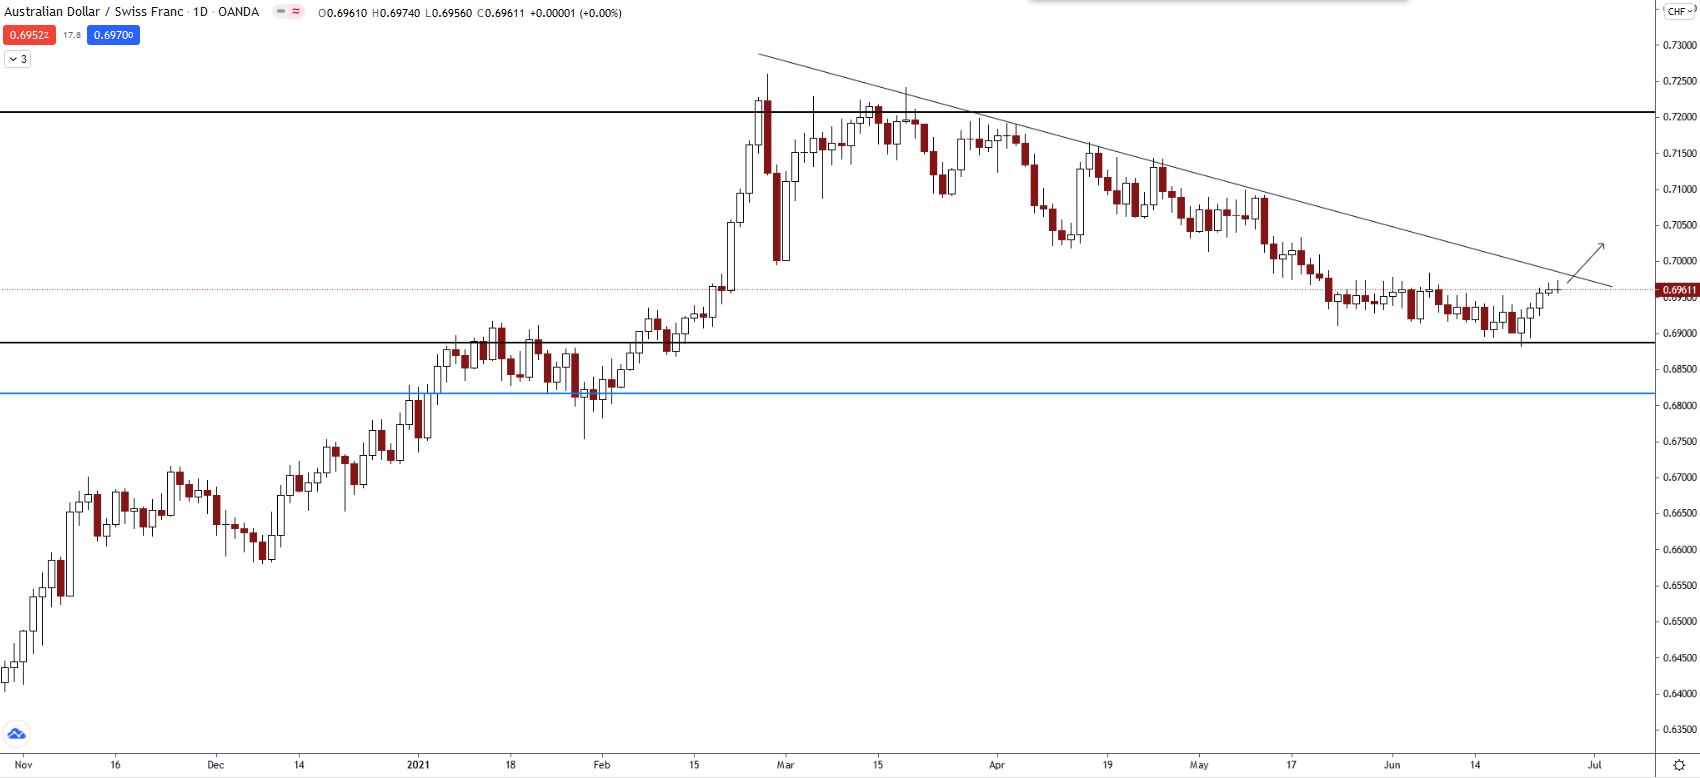
EURCHF Weekly - My order was picked up. Price bounced off a weekly SR level (black line) that’s acting as S and R multiples times. I hope to ride this to the monthly R level, around 1.112:
AUDNZD 1W - Nice little downtrend playing out so far, we’ll see if price makes it to that S level 1.064:
To simplify SR levels, I like to switch to a line graph:
Never forget that these SR lines are actually zones, so always allow for some play on either side.
1 Like
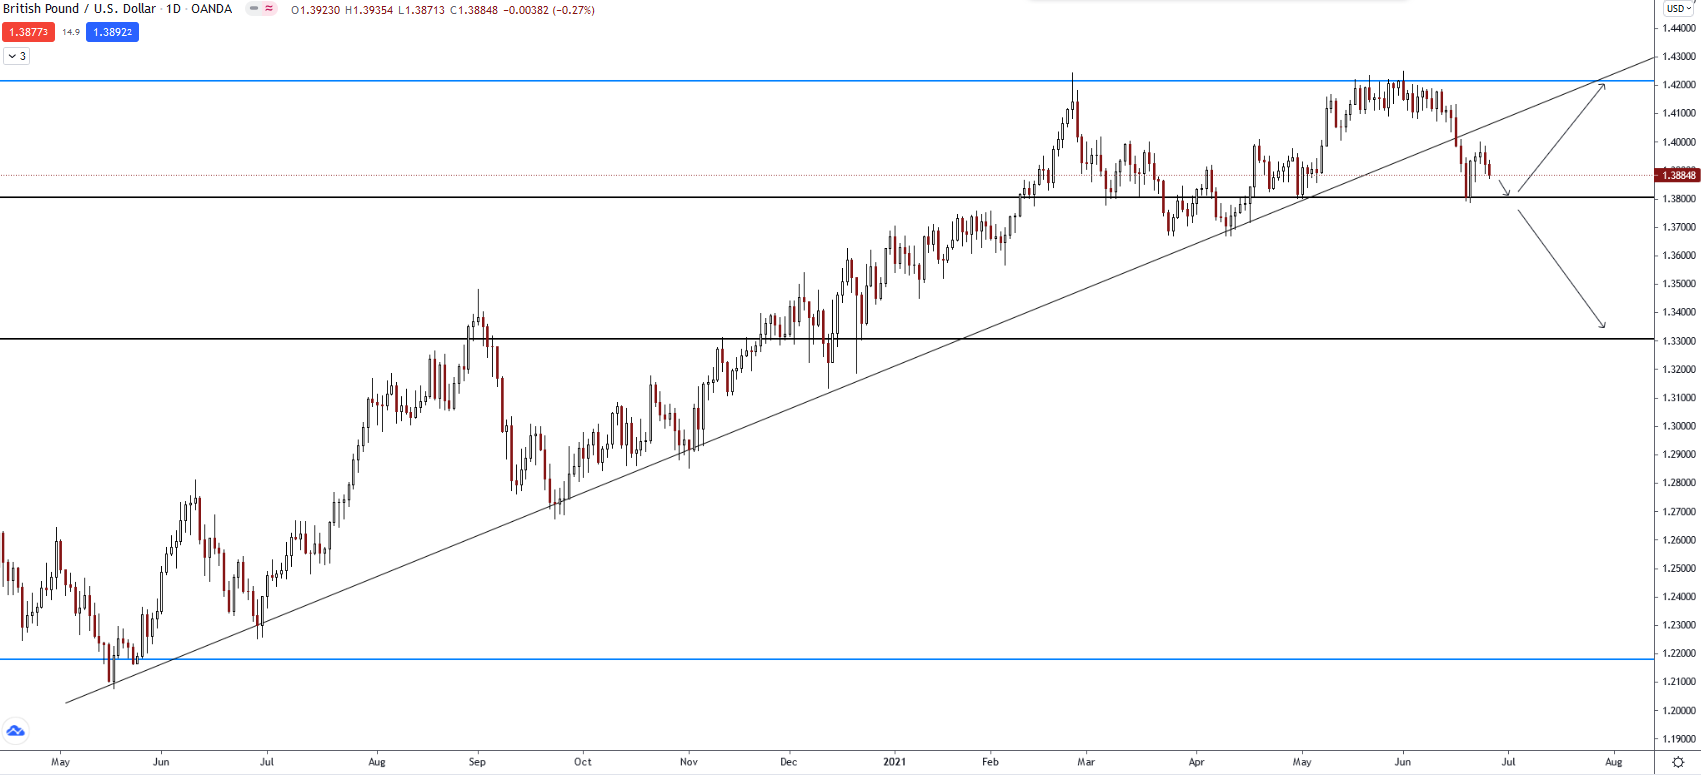
GBPUSD Weekly - I’m liking this setup so far. Price bounced off the weekly S and appears to be retesting the monthly R (blue line). We will see this week if it continues to respect that uptrend.
A look at the daily chart shows a couple of possibilities:
1 Like
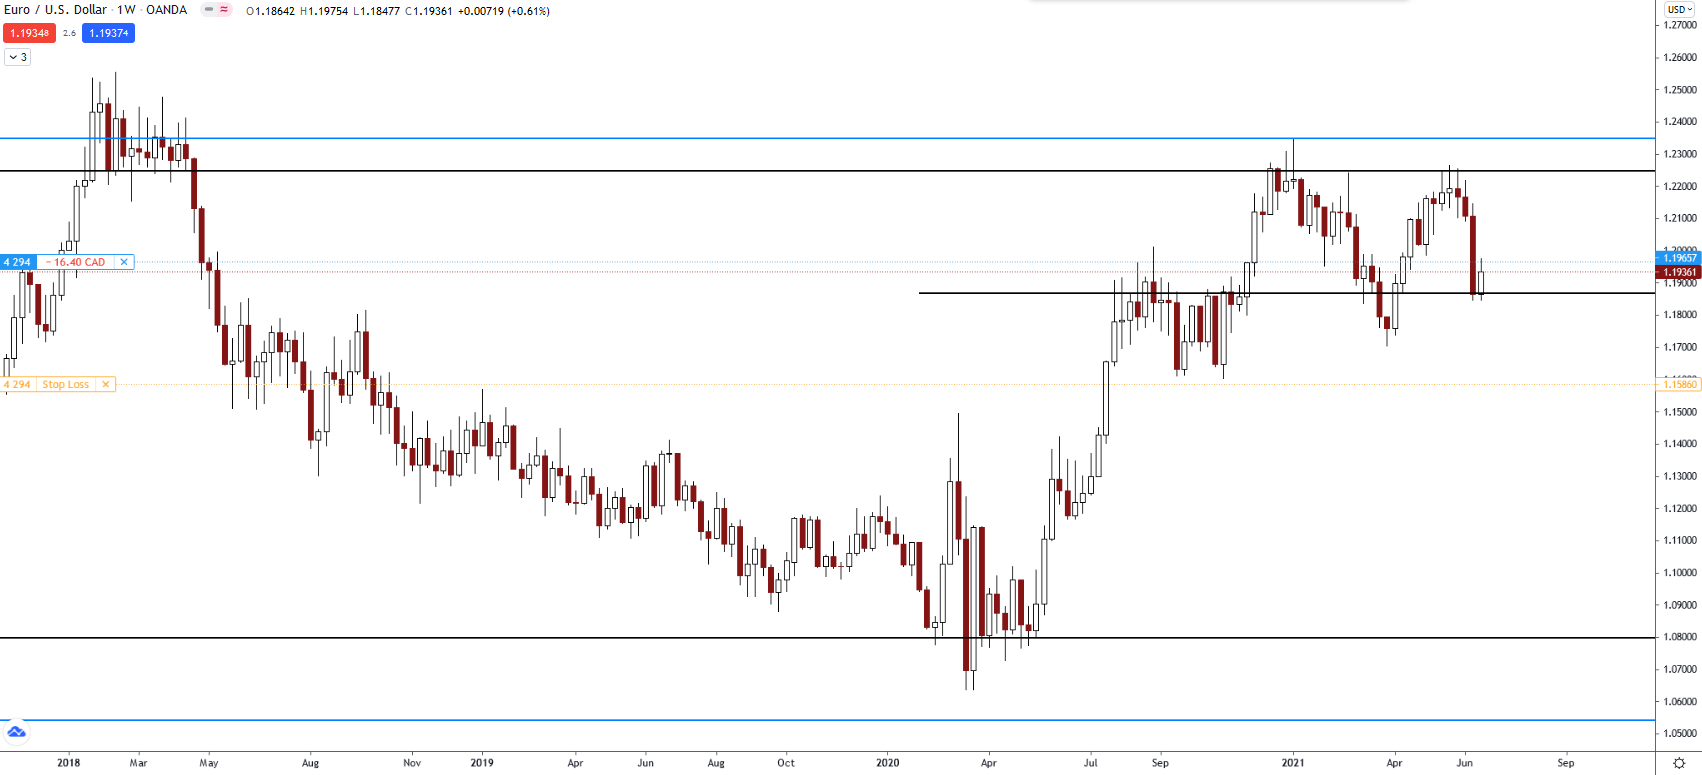
EURUSD Weekly - I’m long on this pair. Small position but I can scale in depending on what price does at this weekly S level (black line):
The Euro is looking good for the time being. Here is what Goldman Sachs has to say:
“As recovery takes hold in Europe, one question is on everyone’s mind: Will it last? Goldman Sachs Research’s Jari Stehn, chief European economist, is optimistic. In the latest episode of Exchanges at Goldman Sachs , he notes that economic data and vaccination rates are strong across the board—and policymakers continue to be proactive. “There’s fiscal support coming from the Recovery Fund, and our global growth views are constructive,” Stehn says. “And that’s, of course, important for Europe, which is a very open economy.” He’s not the only one feeling encouraged; markets are bullish, too. The Euro Stoxx 50 is outperforming the S&P 500 and Nasdaq indices, and investor flows into the region remain positive, notes the Global Markets Division’s Rich Privorotsky. “We’re really starting to see some European outperformance for the first time in a number of years,” he says. “Ultimately as long as we continue to see a unified Europe—one that is unified in fiscal expansion—I would say the longer-term prospects of the [region] look very attractive.”
AUDJPY Weekly - Strong buy signal at the start of last week. I had 2 long positions on this pair which I closed Friday, then I went back in.
I am watching that R area (black line just above current price) this week, if price gets past there then I’ll scale in another position. It’s a fairly strong R area that’s been tested several times, but if price keeps respecting that channel then it shouldn’t be too long now before it breaks through.
GBPJPY Weekly - This pair is at an interesting level right now:
Probably one of the cleanest moving pairs when you look at it long-term, you can easily break it up into sections using SR.
I don’t anticipate a break-down of the Pound, and JPY has been weak for a long time now. It will take a turnaround of the YEN to send price back down, but hey, stranger things have happened. Maybe the Yen is due for a good run.
AUDCHF Weekly - This pair looks promising:
But, before I go long I would like to see price breach this downtrend on the daily for a few days:
1 Like
I came across this post from a LinkedIn member I’m following, so I take no credit, but it’s a great summary:
-
Government prints money 
-
Inflation devaluates the currency 
-
Assets (stocks, digital assets, real estate) go up 
-
Those who hold assets retain their wealth 
-
Those without assets lose their wealth 
-
Hence, the rich get richer while the poor get poorer
Hope everyone had a good trading week. And enjoy the long weekend CA and US friends.
GBPUSD 1D - Price broke through the weekly S level Thurs, but recovered a bit Friday to close above.
4H - This short-term downtrend is still in play. I want to see it break through those 2 R levels before thinking about buying. Here’s one scenario:
Here is a great example of how stop loss orders can protect your account:
I placed this order several weeks ago, if it was a market order then I would have been stopped out.
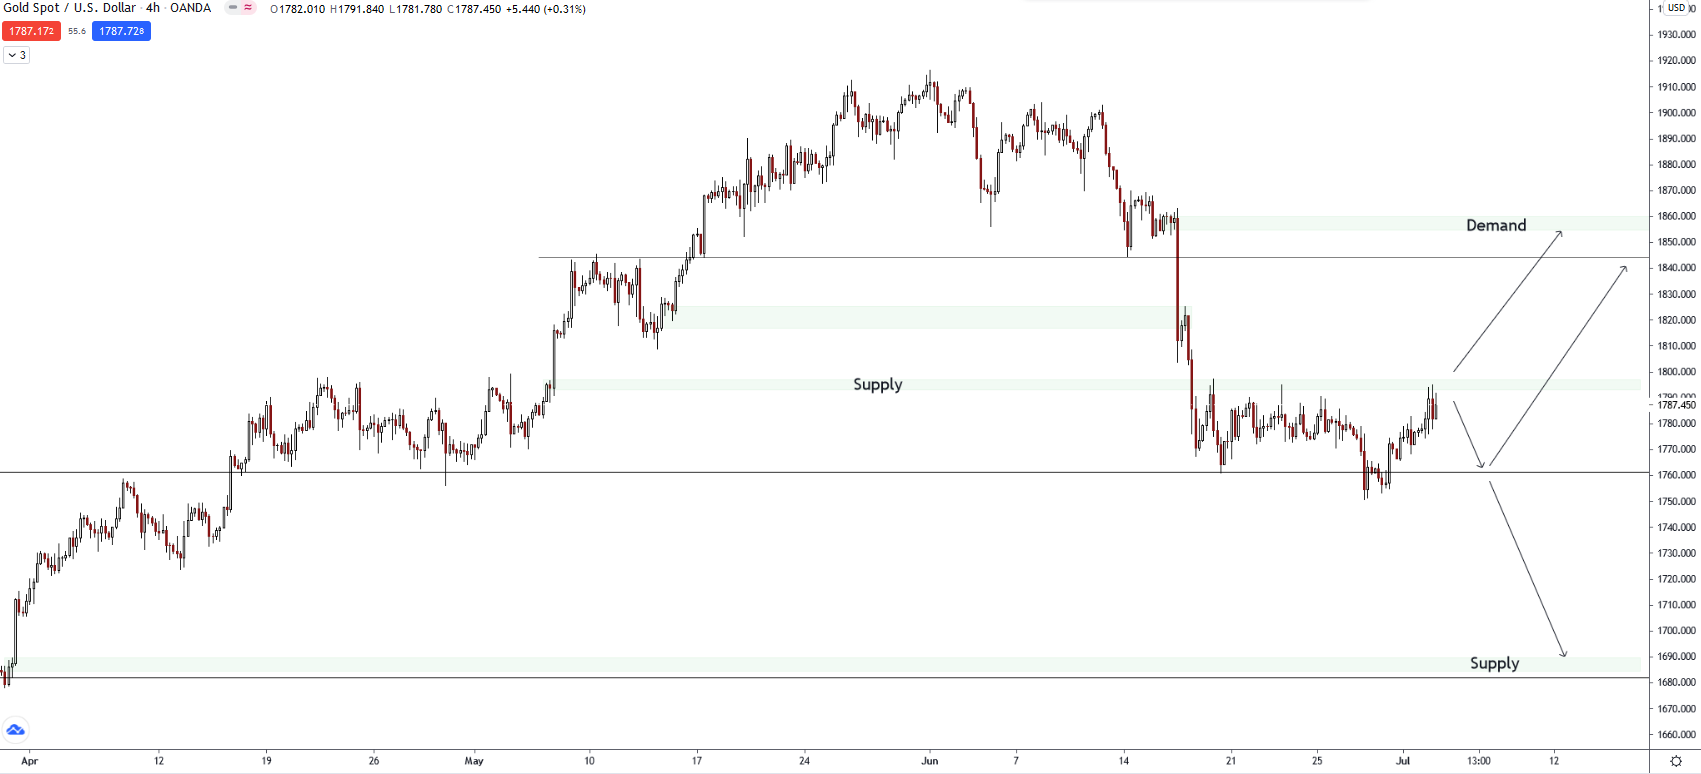
Gold 4H - I find 4H S/D zones to be quite effective with Gold.
Looking to break through the supply zone, up to demand at 1853, with resistance around 1843.
Alternately, price could fall back down to supply, around 1690.
Daily chart - price has bounced off R around 1760, possibly signalling a continuation of the up trend (which is more obvious on the weekly chart).
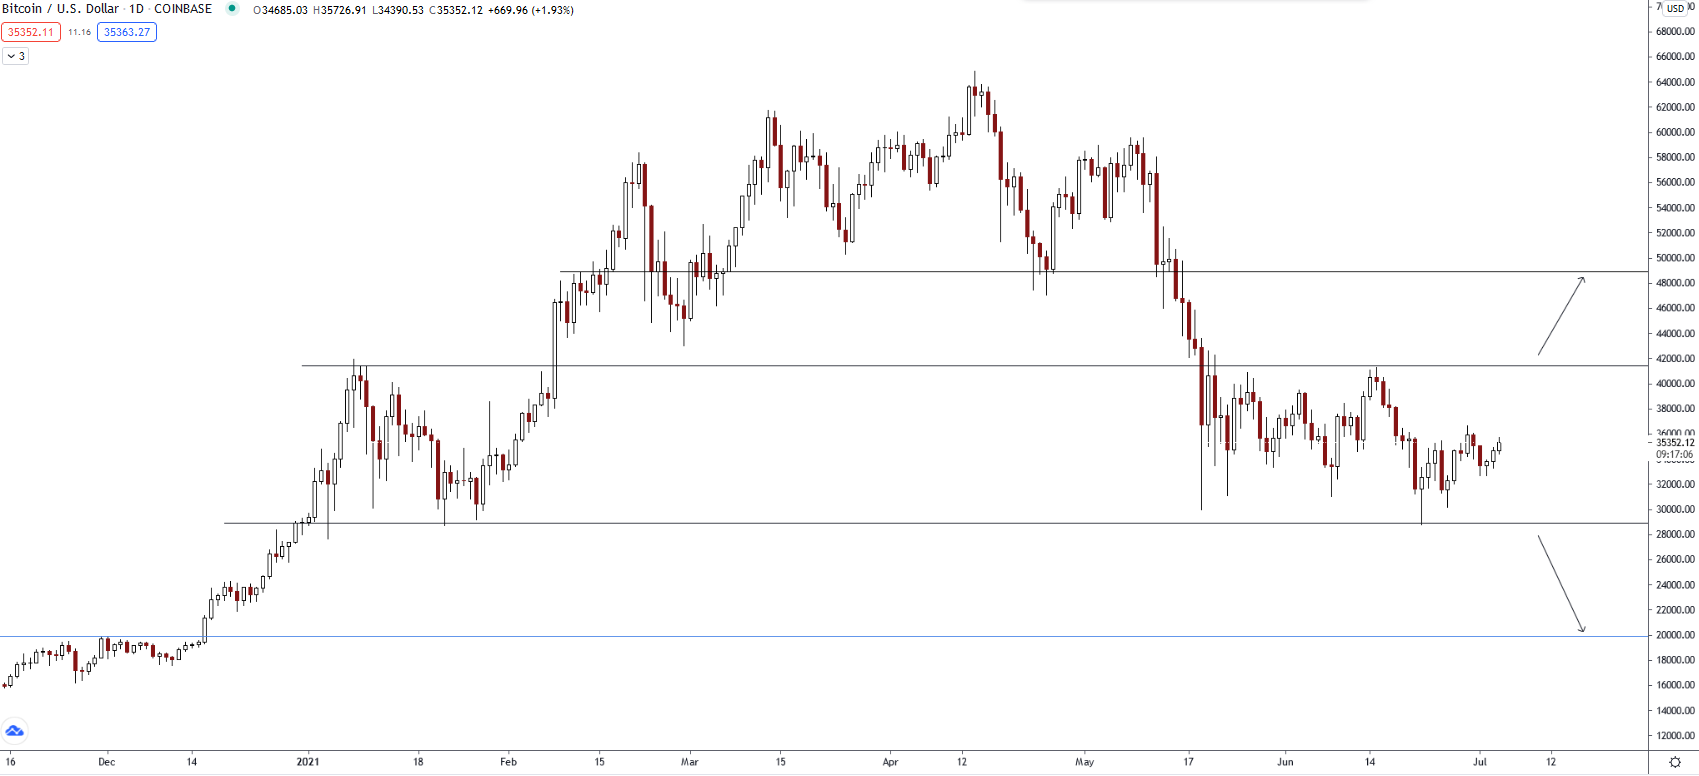
Bitcoin Daily - I’m not holding or trading this ATM, but wanted to point out the structure/pattern forming as it matures. Using S & R we are able to separate it into levels where we can look for price breakouts:
1 Like
NZDUSD Weekly - I’m watching this for a long position.
4H - Price has been falling consistently since May 26th and tested that diagonal resistance area on Friday. It also bounce off support, tightening its range. I’m looking for a breakout to the upside to complete a double bottom.This could send price back up to test the monthly R level (blue line). The monthly blue lines are key for me on determining where price is going long term.