GBPUSD 1D - Price broke through the weekly S level Thurs, but recovered a bit Friday to close above.

4H - This short-term downtrend is still in play. I want to see it break through those 2 R levels before thinking about buying. Here’s one scenario:
GBPUSD 1D - Price broke through the weekly S level Thurs, but recovered a bit Friday to close above.
4H - This short-term downtrend is still in play. I want to see it break through those 2 R levels before thinking about buying. Here’s one scenario:
Here is a great example of how stop loss orders can protect your account:
I placed this order several weeks ago, if it was a market order then I would have been stopped out.
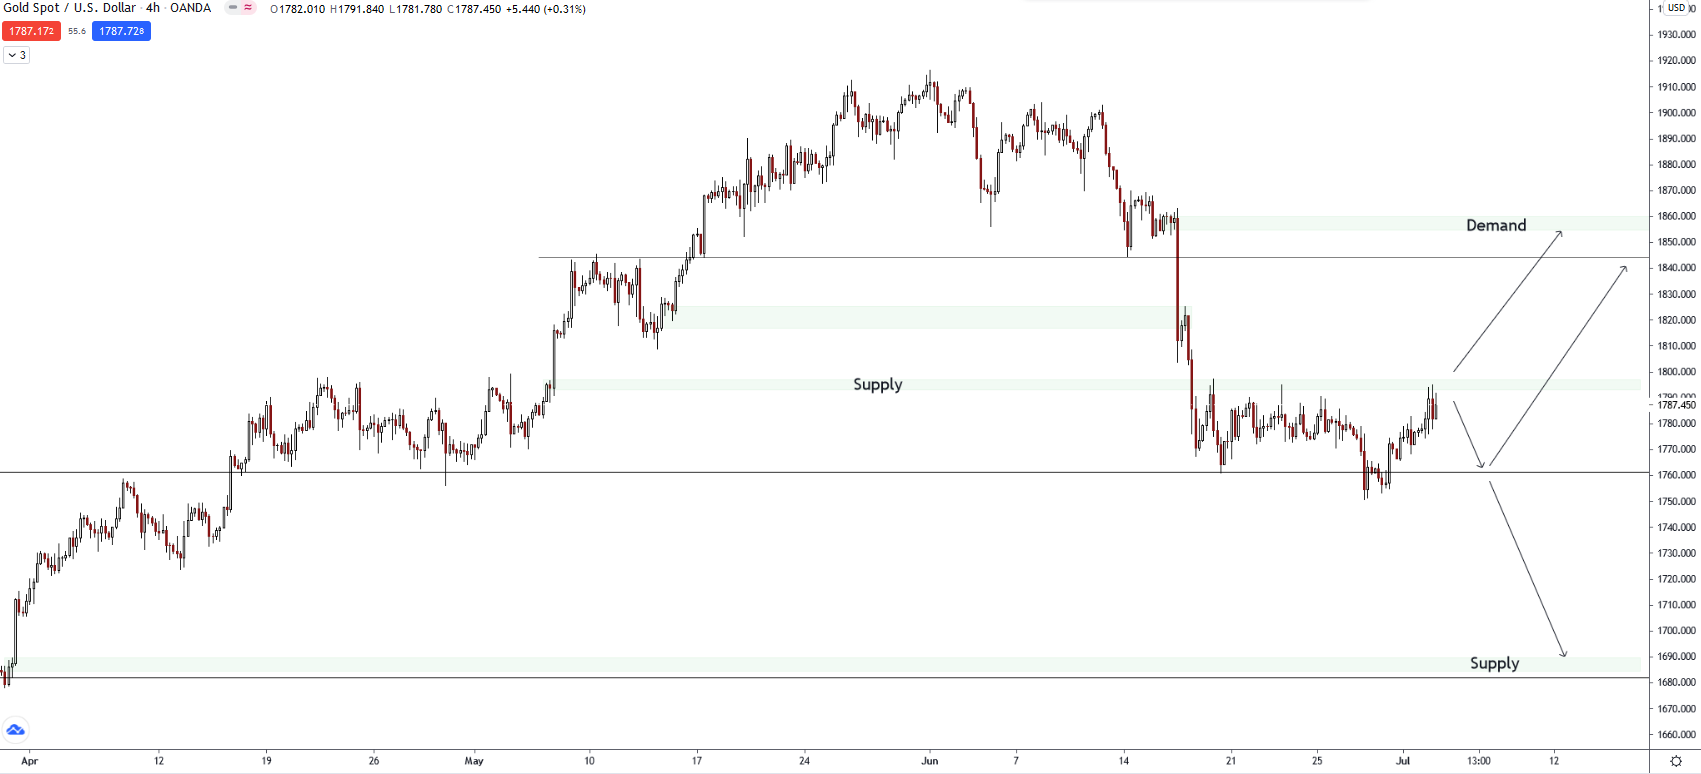
Gold 4H - I find 4H S/D zones to be quite effective with Gold.
Looking to break through the supply zone, up to demand at 1853, with resistance around 1843.
Alternately, price could fall back down to supply, around 1690.
Daily chart - price has bounced off R around 1760, possibly signalling a continuation of the up trend (which is more obvious on the weekly chart).
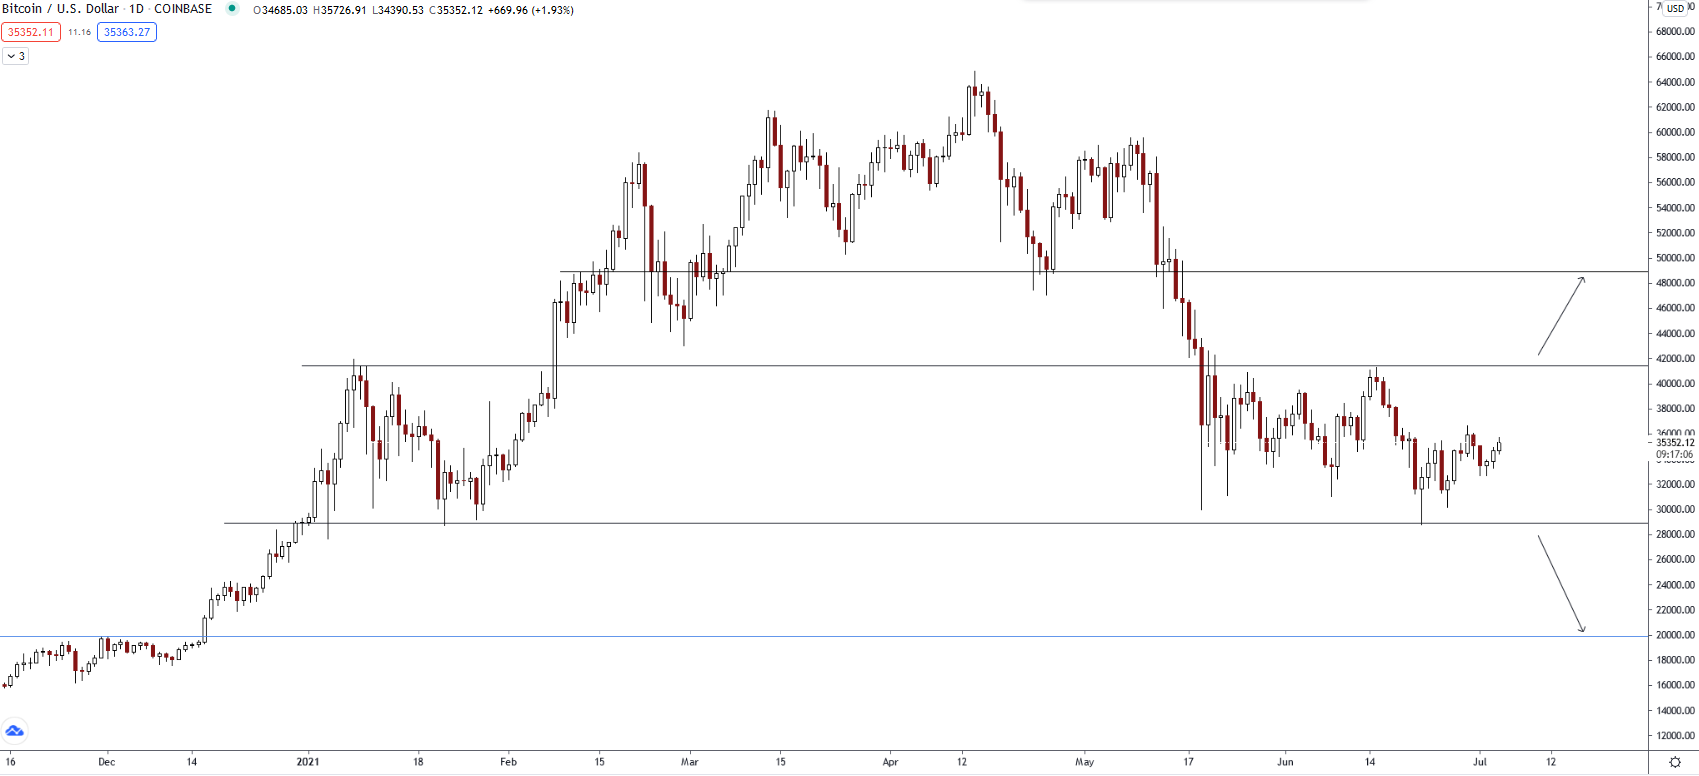
Bitcoin Daily - I’m not holding or trading this ATM, but wanted to point out the structure/pattern forming as it matures. Using S & R we are able to separate it into levels where we can look for price breakouts:
NZDUSD Weekly - I’m watching this for a long position.
4H - Price has been falling consistently since May 26th and tested that diagonal resistance area on Friday. It also bounce off support, tightening its range. I’m looking for a breakout to the upside to complete a double bottom.This could send price back up to test the monthly R level (blue line). The monthly blue lines are key for me on determining where price is going long term.
UK 10Y Gilt. Weekly - Not something I trade very often, but I’ve put it on my watch-list because price is riding the bottom of that weekly channel. Might be worth opening a small position and putting my SL just below the channel:
We had a fake break through the 2 R levels, but price is still respecting the diagonal line which turned from R to S, as predicted, creating a new Demand zone that I now need to watch.
I’m waiting to see if price bounces off that SR level on the retest, if so it will look for the Supply zone. A fake break will likely send it back down to Demand.
Silver Daily - Buy order was picked up yesterday with a bounce off the diagonal S line.
There’s a bit of concern having price making a strong move down from the monthly R level (blue line), but, that move was strong enough to create a Supply zone on the 4H:
So I am expecting recovery back up to at least the R level.
Zooming into the daily chart, I would want to see price drop below both S levels on that channel for a true trend change. . In the meantime, this pair is still trending up on the daily chart.
AUDCAD Daily - Going down?
Price has been flirting with a major monthly S level (blue) since the end of May. Looks like it’s ready to make a move, but which way? This S has held up for over a year now.
AUDCHF Weekly - Relative to my previous post, this pair is also sitting at a major monthly SR level:
This is where fundamentals come into play. AUD has clearly been the weaker currency, but that doesn’t mean it will continue to be. I’ve got my eye on which side price breaks out of that channel on the daily chart:
USDCAD 4H - Expecting a pullback from the Supply zone next week:
Weekly - I’ll be looking to buy on the retest of the weekly SR level:
CAD remains weak, and USD has been strong.
GBPUSD 4H
We’re back down to the Demand zone:
Weekly chart - We will see what happens at that Support level. I am bullish on the USD long-term:
This is where TA such as drawing SR levels can get very subjective. Price breached the diagonal Support level this week according to my previous analysis (blue line). However, taking another look there appears to be more room before turning back up (black diagonal line):
Trading with the weekly trend, using monthly (blue) and weekly (black) SR levels. Some decent profits here last week:
Beware as fees and spreads can be high on this pair.
CADJPY 4H - This pair has been among the top SW rankings for a few weeks now, with JPY showing strength, and CAD doing a 180 from strongest to weakest (Oil has follwed).
I’m expecting a bit more of this before a pullback around 86.40, or maybe even 85.80:
This price lines up with a weekly S level I have marked out:
MY TA for most JPY pairs is showing signs of strength continuing for a while.
EDIT
Another more likely scenario, since we quite often find ourselves in opposite-land on Mondays:
AUDCAD 1D - Been ranging for a while now, hovering around a monthly S level (Blue line). Also approaching Resistance of that long-term channel down. Your guess is as good as mine, so I’ll be staying away from this one until I see some sort of direction:
EURGBP 4H:
GBPCAD 4H:
NZDCAD 4H: