The time-frame you mention, 5 minutes, is the time-frame of your chart - so each bar or candlestick has a duration of 5 minutes.
Usually on a chart, the MA takes the same time frame as the chart, and its period is the number ahead of the MA abbreviation. So a 200MA on a 5-mimute time-frame chart would normally be a MA of the closing prices of the last 200 5-minute candles.
On some platforms, you can select the time-frame for the MA so it is different to the chart, so your software might allow you to display a 200-day MA on a 5-minute time-frame chart.
I’d highly recommend demo-trading this approach until you’re consistently winning.
The issue is that with a slower MA, whether it is an SMA or an EMA , is you will miss a large slice of the trend. On a 5 min chart a trend is not going to be that big. Remember a bull trend or bear trend on a 5 min chart maybe nothing more than a pullback on a higher timeframe or a bull leg or bear leg in a trading range again on a higher timeframe.
I personally like a 20 EMA on all timeframes but that’s just the way I trade. It is up to you to experiment with various MA until you can find one that consistantly gives you results.
Some traders even use multiple MA so that is another option.
IMO, trading a 5M chart is a quick recipe to failure and loss of your capital, as it’s a gamble, and it’s a truism that pro traders would agree.
The 200 MA is used by pro traders - and the banks - on at least the daily or weekly chart to establish a clear long-term trend. I would suggest it just wouldn’t work on low time frames, where you need a faster response in synch with the trading volume.
As stated by others, test out your strategy on a demo account - it’s an ideal experimental way of learning.
Justify your argument. Personally i never criticise anyone for trading on any timeframe as there are many successful traders using multiple methods of trading on all timeframes.
I usually find that traders that make rash statements like this one only have come to that conclusion because they themselves are unable to successful trade that timeframe and assume that it is not possible to make money trading that timeline.
Bottom line is that if you understand price action you can trade any timeframe successfully.
You’re right, of course. As I am. Everyone is different, and there is no ‘one cap fits all’ approach to becoming a successful trader.
Having said that, I would suggest that for any newbie it’s a risky strategy to constantly trade the lower time frames because of the number of probable trades available in any one day’s trading - apart from using a demo account to test out what works best.
Which means, while possibly sustainable in the short term, most would burn out if they still haven’t made a million quickly - and why many of the often quoted c.90% of traders fail.
Which is the justification espoused on my original post.
While overall I agree with @steve369 (and others) assessment of the 5 min TF… It can be a great time frame to demo on and learn your Platform, the various currency behaviors, and cause and effect of trading win/loss ratios…
As for Moving Average Strategies… the possibilities are literally endless… A search of the forum reveals hundreds of combinations and strategies that have been suggested.
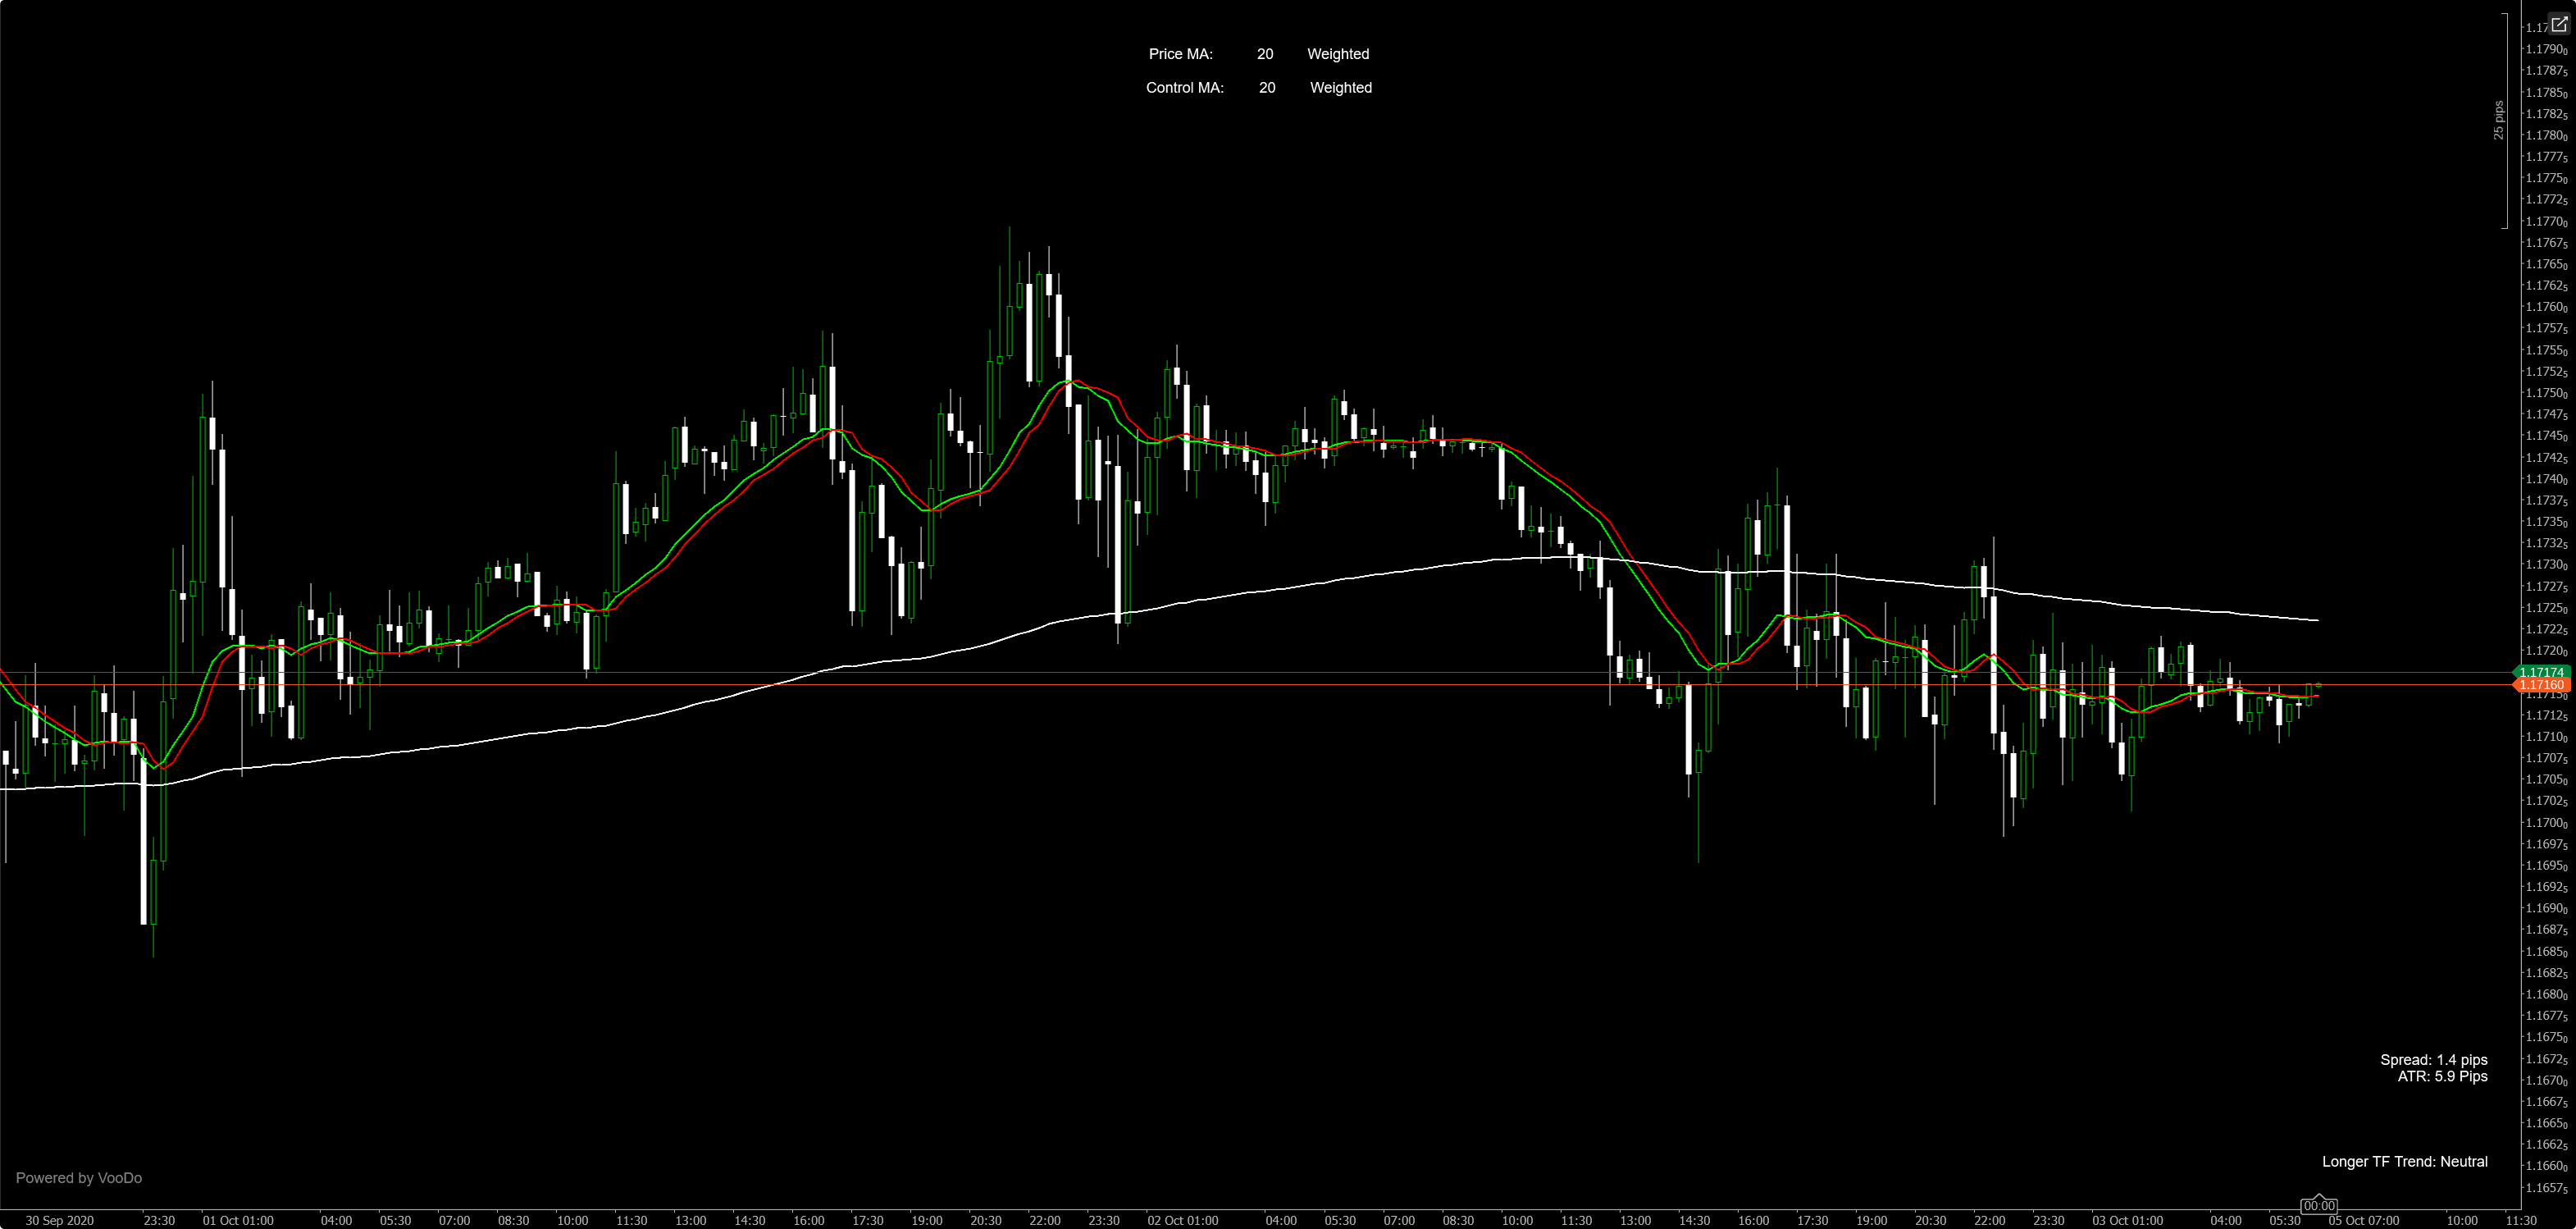
A simple beginners strategy (Posted by @Quadpip) I liked was to use (see below) two Moving Averages, same periods with the Green set to <Close value and the Red set to the <Open value of each candle… It was a great way to remove the noise from the somewhat volatile price action this week…
Try and find the least volatile pair (start with the Majors) apply the above strategy to a 15 min Chart (or higher) and trade (Demo) the 5 min in the same direction as the higher timeframe…
No you haven’t justified your reason. In your original post you stated that it is gambling and a recipe to failure and a loss of capital. How so?? How did you arrive at these conclusions??