Graviton, this is USD/CHF monthly. Do you thinks this trendline is significant? If so would a long swing trade be in order since there is a solid break?
Graviton, this is USD/CHF monthly. Do you thinks this trendline is significant? If so would a long swing trade be in order since there is a solid break?

Here is weekly with higher highs trendline drawn and monthly trendline recently broken. Hmmmm

And here is 4H USD/CHF. Blue TL is monthly, black is weekly and red is 4h with lots of touches. And look at the squeeze on the BB. Somethin gonna happen :eek:
Graviton, awesome set up, makes complete sense by covering your trades and moving your SL to BE
Not really my cup of tea, but awesome
Hello Didilut,
would you post MQL4 SHI channel uncompiled code if you have it?
BTW, its my demo account.so worry non.
what I am trying to do is find a way how to turn negative pips to positive. 
Confused ??? well, its up to you. I know some traders who trade without stops 
Any ideas welcome
Trading without stops is a disaster waiting to happen. Don’t do it even fooling around. It’s a horrible habit to get into. What will happen is you will win many trades because you let your trades run very far into negative and eventually most of them come back to at least break even. Then eventually you get on the wrong side of a trade and it doesn’t come back and blows out your account. You lose everything on one bad trade. I’ve seen this happen more times than I can count. Don’t let it happen to you.
In fact, the problem most new traders have is just the opposite. They lose way too much with bad entries into bad trades. Keep track of how many of your entries go positive right after entry and how many go negative right after entry. Also track the final result of those that go positive right after entry and those that go negative right after entry.
It usually breaks down into the 80/20 rule, that 80% of your pips won come from the 20% of trades that go positive right after entry. This is why I enter trades with very tight stops. I have studied my trades extensively and found those that go positive right after entry have a very high expected win/loss ratio. Those that go negative right away have a much lower win/loss ratio. You need to log your trades in your journal and do this study yourself. Only you can do your own work on this.
Once you have done this work for yourself and discovered your own ratio, which will vary from trader to trader, what do you do with it? One thing will be to exit trades that move against you right after entry faster. Your trade analysis may or may not have been good, but your entry is bad if it moves 6 to 10 pips against you right after entry. By exiting quickly, you cut your loses short and give yourself another chance to either correct your trade analysis or gain a better entry at a better price.
The other thing you can do is use lower time frames to gain better entries. Say you are trading the 1H TF, use a 15M Stoch filter and only enter on valid CBL entries, when the higher TF (4H) trend is in the direction of your trade, and the 15M Stoch filter is also in the direction of your trade. That should improve your ratio. If it’s still not enough, add a 5M Stoch filter, so you only enter the trade if both the 5M and 15M Stoch is in the direction of your trade. Of course, you must maintain the conditions of a valid CBL entry in the direction of the higher time frame (4H) trend as well. This will reduce the number of trades you can enter, but if you analyze it carefully you will find it reduces the bad entries much more than the good ones. You can extend this technique down to the 1M time frame, but as you extend it further away from your home time frame it has less effect. But I encourage you to try it and do the work yourself to optimize your entries. It’s amazing how a 50% reduction in bad entries will affect your final trading results.
These are the methods you use to turn negative pips into positive pips. Logging your trades in your journal. Careful post trade analysis. Testing. Optimization. Practice. It’s lots of work. Logging your trades for things you want to test and optimize is a requirement. Doing post trade analysis is a necessity. There are no shortcuts or easy solutions that I’m aware of. Anything that seams as simple as trading with no stops has certainly been tried by thousands before you and failed to produce the intended results. So try this method to improve your entries and if it doesn’t work for you, then I’ll help you step by step to achieve the results you are looking for. If you wont do the work to try it though, and waste your time trying to find easy shortcuts, I really can’t help you. No one can until you move off that path and onto one of logical analysis and practice. That’s just my own humble opinion on this subject.
What method are you using now Forex Wales? How is it working for you?
[QUOTE=RenaLa;193699]Hello Didilut,
would you post MQL4 SHI channel uncompiled code if you have it?
BTW, its my demo account.so worry non.
Ready to be used, try different settings.
Cordially:)
Didier
SHI CANAL.zip (1.86 KB)
Hello, Mr. Graviton.
I love your avatar:p
Could you confirm that I understand the taking of additional lots to minimize the risk:
Enter for a TP of 20 pips
Expecting a possible retracement (difficult to determine) and open a second batch with SL to BE the first batch and so on, and let it run a stop leak
I do not know if I am very clear …
My trade thread posted on Tymen was a simple stacking of lots of 25 pips with SL to BE, the first batch which was closed at 25 pips to protect the minimum profit
The lots were no take profit but with a trailing stop of 25 pips
Thank you for the comments
Cordially:)
Didier
Yes, I answered your question in more detail on Tymen’s The Finest In Trend Trading thread. I think you are getting the method down. If you have any more questions after reading my posts on Tymen’s thread, I’ll be happy to try to answer them.
It’s Saturday and the markets are all closed. I like Saturdays as I use them as days of study, reflection and planning for the next week. I just ordered a pizza to feed my family as I will be a bit too busy today to grill outside. Family first, always.
I just completed my post trade analysis for last week. I had an average week with one great day where I made 150% of my stretch profit target. The rest of the days I had to console myself with smaller pips. My win/loss ratio was very good, over 2/1, and my risk reward ratio was average.
Now I will review lessons learned from the week and review my trading plan to see if there is anything I can do at all to revise it to improve my trading. After decades of trading, I still find tweaks and small improvements to the plan and I still review it every Saturday. The last major changes were a couple small revisions to the 5 lot strategy and adding Tymen’s CBL entries to my well tested entry methods. The plan is well enough developed over the years that it is memorized now line by line and I know the instant the evil thought creeps into my mind of violating it while trading. A big flashing red light comes on and I hear alarm bells in my mind. I try to put that evil thought out of my mind as quickly as possible by doing something constructive instead. At this stage review and revision rarely takes more than one hour.
I still do this the old fashion way of working from a three ring binder with tabs for Trading Plan, Trading Log, Post Trade Analysis, MTF Pair analysis, Lessons Learned, and Demos and Testing. I started doing it this way before PC’s were even invented and I like my old timey ways.
When I finish my trading plan review I will do an MTF analysis of pairs I intend to concentrate on next week. This is really just an update of last weeks review and will take about 2 to 3 hours to complete. I’ll then look for lessons learned in my trading plan, trading log, post trade analysis and pre-trade preparation and list all I find. With any luck I’ll finish by 5 PM and spend the rest of the evening with family.
Pizza is here and time for a break 
I just ordered a pizza to feed my family as I will be a bit too busy today to grill outside. Family first, always.
That cracked me up.:)I dont trade the same way but Your words of wisdom that you have posted and the knowledge that you share I find is fantastic thank you:D
LOL
I was going to ask you if we should forget completely about forex until Sunday, but this post answered my question
have a nice weekend!
Thanks for the chart. Your review of longer term charts looking for steady trends and reversals is just the thing we need to be doing to make long term trades. I also look at fundamental relationships in the pairs. The Swiss Franc pairs are subject to intervention by the Swiss bank at any time, and that intervention disrupts the natural market forces. For that reason, I have been avoiding the Swiss Franc pairs, but that might not be the smartest thing to do.
Word on the street is China has been trying to diversify their central bank holdings away from the USD since the 2008 financial crisis. They initially moved into the Euro and drove it up, but when the Euro crashed in late 2009 due to the Greek financial problems, China began to diversify into the Swiss Franc and the Yen. That Chinese diversification along with other internal economic factors has brought the Franc and Yen to near all time highs. Both the Swiss Bank and the Bank of Japan are struggling to sell enough of their currencies to hold the value of the currencies stable relative to the other majors.
This sounds scary, and you certainly don’t want to trade against a national bank, but the Swiss only intervene in one direction, to reduce the value of the Swiss Franc, or push up the price EurChf and UsdChf. So if you happen to be holding a long position and the Swiss intervene, which they are likely to do every couple or few months, you’ll likely get a nice quick boost.
What we need to enter this pair with a long term buy is a good retracement to the short side. The problem is that it’s trends are so persistent, it could easily be a year or more before a good retracement occurs. We’ve now had about 10 up weeks in a row. That’s unusual for any pair, but if the central bank wants to drive up the USDCHF (and even more importantly for them, the EURCHF), they can do that for as many weeks in a row as they want. The only real limit to how many Francs they can print is the internal inflation rate and at 1.4% that is no practical limit at all.
So, understanding all this we would like to get in on this long action, but the only way to get in is to chase the current move, and we never chase to enter. But there is another way. We can drop down time frames and if we find a legitimate entry on a lower TF, we can take it and perhaps walk it up to a longer term trade. If we fail in our attempt to walk up time frames, we can still make a nice profit on a short term trade, if that trade was a legitimate one in the first place. And worst case, the stop will be small so we will risk less than directly entering on a longer TF.
Looking at the 1H chart, we see we have a still valid CBL entry. Of course, price is today very close to the mid BB, but we don’t care. We are looking for a 500 pip move, not a 50 pip move. We are just trying to see if we can justify a long entry here.
Looking at our other trade filters, the Stoch, RSI, ADX and moving averages all favor this trade. The only fly in our soup is MACD. MACD is below centerline on the 15M, 30M and 1H charts. You should do your own research into each of these indicators and understand them inside and out. None are a magic bullet and none really can tell you anything you can’t see in Price Action, but they can serve to filter out bad trades, and in trades lasting weeks to months to years, we have no concerns about the lag of indicators. So let’s focus in on the MACD, the fly in our trade soup.
Let’s all study this onerous MACD indicator for the 15M, 30M and 1H TF and decide if it should keep us from entering this trade. If yes, then we would have to wait and watch for what? If no, then where should our entry be, what stop loss do we use, how will we manage the trade, what will our position size be, how will we exit?
If you want me to help more, you’ll need to create a specific trade plan for this particular trade. We can make this a group project. Anyone interested in Long Term Trading can give their input and I’ll give mine and we’ll form a consensus as to whether this is a good trade or not. You can use Hachiko’s previous trade plan and my sample day trading plan as a starting point. If you need any help, let me know.
Well Graviton I think I might fail this because i am going to attempt to do this without indicators o.O
I am going to do this by looking at past price history and the various support and resistance levels. It is pretty amazing how they line up.
So here is chart 1 starting from November 2009.

The first red line where the arrow is drawn lines up perfectly with Fridays close!!
Also pay attention to the low/support.
Ok here is the second chart showing where we are now.

Now going with the trend and your analysis. I would have my first TP at 1.1741 for a gain of 246 pips.
TP2 is 1.1956 for a total of 461 pips. Pretty close to your 500 pips.
With TP3 marked as the top resistance line at 1.2291
Which would be a 791 pip run. Play it safe and just go for 750 pips.
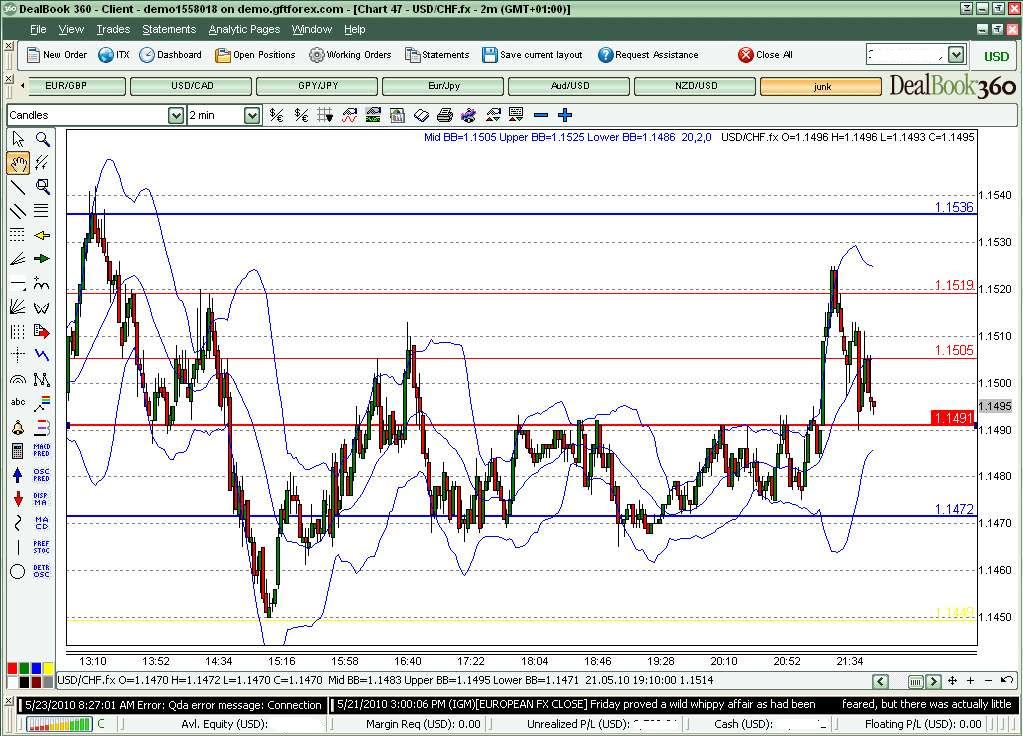
Going to the 20 min chart for entry.
Shows an entry using cbl to be 1.1473 with a 10 pip stop.
But…
The 2 min chart shows a possible better entry around 1.1491
Almost a 20 pip difference.
And that’s all I have.
Here is my usd-chf trade plan
As we can see PA has broke red down trend line that has been formed since middle of 2001.
Here is image of usd-chf montly chart

Also I drew down channel in blue, that PA about to reach.
If it would happen, then TP1 will be at 1.1782. I won’t be greedy my TP1 will be at 1.1750
I drew side channel in brown which between the levels 0.9945 and 1.2265
If PA will broke blue upper line of down trend channel then TP2 will be at 1.2265 (my would be at 1.2250)
But I should say about entry
Here is daily USD-CHF

I can see that small retrace is forming.
Now, I will zoom in retrace
Below is 30M chart

I see like PA is acting inside the channel which I drew in dark green, PA is slightly down as it makes lower highs
Wonder if PA will return below monthly red downtrend line? hmm
Probably it won’t because I can see that flag pattern is forming on daily chart, so there is more possibilities that PA will continue to rise.
In case PA will bounce off the Monthly red line, will it be the long entry signal or should we wait until PA will broke upper green line of the side channel??
Or should we open short entry in case PA will return below monthly red line?
There is no entry position yet
Or can I just place Buy order about 20 pips above upper green line? ah?
1st things first. I have set up a demo account just for swing trades.
Since I am trading mini’s I will have 2 micro’s waiting patiently in the wings to begin their long journey north.
The pair is in an area of some interesting S/R levels. It seems that one would not want to make an entry until PA shows some bias. I will have 1.220 as a long term prospect for the trend as this was the most recent high reached in 11/08. 700± pips.
If this shows not to be a reversal I will be looking for a decent CBL entry on the lower time frames. I will place a wide stop on this entry. Maybe 200 pips, the ATR of the daily.
Since the PA is in a nice channel up I will watch this channel closely. If the northerly direction continues I will add lots accordingly paying attention to 1.1600 and 1.200 as next resistance levels.
During any reversals on the way up I will exit some lots if PA moves outside the channel and possibly enter 1 or 2 lots as a reversal swing trade with a wide stop. Plenty of time to think about this.
If PA falls back into the channel I will re-enter and cash in the counter trend swing trade. I will always be aware that the Swiss bank is notorious for manipulating the franc and thus not panic when price takes unexpected dramatic drops in the day trading world. No adrenaline rush but less gray hairs. I like the trade-off.
As far as the MACD issue. From what I have learned the MACD is not the best indicator in ranging markets. The 1H, 30M and 15M are all ranging however the W & D both show buying signals so since we are talking swing trade I guess in my lowly newbie status I would not give this indicator much weight for entry. Must ALL the stars align for such a long term trade?
Graviton Hello, and thank you for the reply
Sorry to create extra work, I was not very smart, and I think the two times before asking the same question.
Apology
Good charts! I agree with your analysis. The indicator question was a trick question. Even though a few of the MACD indicators are below the midpoint, they are heading up to the midpoint, which in MACD land is a bullish signal.
Really the only point is, when you are planning a trade of weeks or months, the lag of indicators is not an issue. But I agree with your method. The closer you can get to actual price action, the more valid the analysis.
Good chart analysis. We are left with two questions, where should we enter, and where should we put a stop. Our “picture” is starting to become more clear though.