Multi-Time Frame Trend Trading

Hello graviton, thank you for your detailed explanation once again.
But i do have a habit or reiterating what has been taught so to assure i got my facts right. Pardon me for that :smiley:

  1. "But if you look at the 1H chart, youā€™ll see good 1H CBL entries on April 15th, a full day earlier than the trade showed up on the daily chart. Once again, I used a cut the extreme candle in half entry in a squeeze (the very best entry in my opinion) and entered at 1.3650 with a tight stop. Using that method of always taking every good 1H CBL in the direction I want to position trade, I was in the trade a full day before it would have been caught off the daily chart. "

So you said as long as you have define the maintrend on the daily and weekly charts you will take any all positions on the 1hr TF that goes with the trend.
What if i missed the earlier entries and the main trend has already resumed back and is somewhat into the middle of the channel, do i still take up the cbl entry on the 1HR TF even though i have missed half of the move?

  1. "So there are three ways to enter this trade. Wait until the cbl on the daily chart and enter with a very large stop, enter with a good CBL on the 4 hr chart which will reduce the stop by about half, but miss some good entries, or lose a bit of sleep sometimes and enter on the 1H chart with a tight stop. Taking all the 1H entries is my preferred method. The method I gave you will automatically take you out with good profit on the many retracements that will come along before a good position trade entry, and automatically leave you in on the best position trade entries most of the time. Youā€™ll need to make adjustments as you go along, but itā€™s close as is. "

So am i right to say if you position trade, you will have your first lot on till the SL is equals to the daily ATR. Thus you know in the 1HR TF you will get many false entries, however you will still make pips along the way before you finally hit the right one. So all these while you will be on 1 LOT till it hits the daily atrm before adding a 2nd lot? Thus you will be on one LOT for quite awhile right?

  1. ā€œYes, the same approach works for a swing trade. The ATR of the 4H is about 1/2 to 2/3rds that of a daily chart position trade, so you can get your second lot on faster.ā€

So for a swing trade do you use the ATR that is provided in the 4HR TF or would you manually divide the ATR on the daily? Or you would choose the ATR which gives you a higher SL for greater flexibility?

4)And how about we are on a retracement, however the 1 TF shows a valid cbl entry to enter with the main trend. However we have yet to break the retracement trendline, do we still enter?

5)So am i right to assume before every trade you must know what kind of trade you are getting into, thus being able to employ the right money management strategy? If position trade, you will have mostly 1 lot for quite a while, if its day trading, you will use your multiple lots of 15 strategy, right?

6)And i always noted you would always use a 15mins stoch indicator to let you decide to enter an entry or not. Somehow for example we know our cbl entry is at 100 and we want to go long. If the price hits 100, you would refer to your 15mins stoch indicator to see if its valid to go long? Or would you refer to your stoch indicator before the price hits 100?
In that sense, you may actually enter before the entry price of 100 if your indicator says its good to go?

Ok that would be my qns i have, haha.
Sorry if i ask alot cus i find the best way to learn is to ASK.

And im truly am grateful to you, for having such great patience.
And by the way, you have a great way of teaching even though you hardly use charts. I can visualise your words clearly despite having no images :slight_smile:

  1. There are several reasons I would not take a 1H CBL entry. 15M Stoch filter doesnā€™t allow is most common. If we are in a clear retracement against the main trend, I will want to look at it very closely. If we are close to breaking the retracement trend line, I may wait just a bit to see if we break it or bounce off it. The majority of time weā€™ll bounce off it, so breaking it is a good entry signal. If thereā€™s been a major change in fundamental information, I may not take an entry in that pair since that could precede a change in the major trend direction. But even if it took all those, it would probably make a very small difference in final results since I enter with such tight stops. Still, every pip counts!

  2. Yes, if you are day trading, your goal is to make as many pips as possible very quickly. Position trading is all about establishing a good position for minimum risk. If you had to pick a one rule fits all, a single lot put on for a 10 pip maximum risk and not touched at all until it hits the daily ATR may be the absolute optimum. But it really depends on the situation. There is no magic formula. Somewhere between not adjusting the stoploss at all between entry and reaching the daily ATR, and adjusting stoploss to capture at least 1/2 the profit is probably best.

If there is magic, it would be to adjust SL to always be above the last lower high in a downtrend, but not to make the next adjustment if it will take more than 1/2 the profit, until the daily ATR is hit. This causes lots of jerky moves in stoploss adjustment, but thatā€™s the way price moves and itā€™s best to adapt to the market rather than trying to find a nice smooth system.

  1. For a swing trade, I use 4H ATR as max SL. Other people use 1/2 daily ATR. I havenā€™t seen good tests on this subject so I canā€™t say which is better overall. It probably depends on the pair.

  2. Your choice. As noted above, this is one of the exceptions where I may wait and watch to see if the retracement trend line is broken a little later. The problem is, if you donā€™t take it at all you save a 10 pip tight early exit loss, but if you do take it you might make 100 or 1000 pips profit. Using those numbers, you should really only ultimately pass up on no more than 1 in 10 to 1 in 100 valid CBL entries of 1H or more (of course always in the direction if higher TF trends). Thatā€™s why the rule of take them all is better than passing up on more than a very small percent. Of course, where Iā€™m just being patient and waiting for a retracement trendline to break, or for a 15M Stoch to turn around, thatā€™s just optimizing entry. Iā€™m not really passing it up, Iā€™m just being patient to make a better entry point. The vast majority of those Iā€™ll still make.

  3. Yes. You go into every trade with a plan and follow that plan, win or lose. After the trade, you can improve your plan, but you never change it in the middle of a trade. Thatā€™s the only way to improve your plans.

  4. Yes. My plan doesnā€™t not allow jumping the gun, even if 15M Stoch is good. You can test this for yourself, but Iā€™ve not had good results jumping the gun.

No problem with good questions. Iā€™m sure many are helped by them.

Hereā€™s version 7 of the CBL Entry Alert indicator.

Iā€™ve removed the choice of CBL strategy. You get Tymen Orthodox and thatā€™s it.

HTFTrendOnly was broken. It is now fixed.

DebugMode has been added. It will show some details about how each CBL decision was selected.

Previously, the developing candle (0) was not considered in calculation. It is now.

The features mentioned in this post still apply.

Please post or PM me any problems.

Great job NB in updating the indicator we greatly appreciate it.:smiley:

Graviton and everyone,
Thanks for everything on this thread. This and Tymenā€™s thread have brought me a long ways in a short time.

What Iā€™ve learned here is 1. Develop plan 2. Analyze your trades
Iā€™m still working on my plan. Part of it is the Sunday gap trades.

This week I entered 5 trades. 1 unit on each

  1. USD/JPY Hit target pretty quick (it was smallest gap) +14pips
  2. EUR/JPY Came within 1 pip of the low of the Friday close candle but missed my profit target. Stopped out at +30pips
  3. AUD/JPY Came within 2 pips of the low of Friday close candle but missed my profit target of close of Friday candle Stopped out at +25 pips
  4. AUD/USD came within 1 pip of low of Friday close candle but missed target. stopped out at +20 pips
  5. USD/CHF Came within 6 pips of Fridayā€™s close. Missed target. Stopped out at +10 pips

I use a tight stop and keep moving it about every 10 pips on my Sunday trades.

What I saw for each of these trades is that they were all against the higher time frame trend. If they started at or above the mid BBā€¦They all reversed at the top BB. If they started at the bottom or below the mid bb - they all reversed at the mid-bb.

Trade 6 for today - Gravitonā€™s EUR/CAD trade idea. I reviewed it, it is in a strong down trend. Open was below the 4H mid BBā€¦I have taken the short at the mid bb at 1.2720. (normally I would not trade this pair due to the high spread)

I hope you plan holds out

NorwegianBlue there may be an issue with the new indicator.

The indicator is showing a CBL Long entry using 1 candle. The pip count is -39.2 pips from a 2 CBL line (black line under text 2 candle back). The current candle appears to be the extreme candle, the previous candle is used for the CBL which isnā€™t an extreme candle itself.

The pip count appears to be showing the difference between the 2CBL line to current PA. As shown, PA is part of the extreme candle.

Hi graviton im still unsure about couple of issues.

  1. If i did not interpret wrongly, if we are in an uptrend channel.
    And the PA has already crossed half the channel, however it is still in the uptrend. And on our 1 hr TF, there is a valid cbl entry to go long, you would go long still right? Even though half of the PA has been moved. Meaning we are in the middle of an uptrend and we did not catch the early part of the move. (Assuming we are not on a retracement)

  2. And lastly, im quite unclear regarding your 15mins stoch. So in other words, when a valid cbl entry is say at 100. You would only wait for PA to hit 100, then refer to your 15mins stoch indicator and decide if you enter?
    If the PA has not hit 100 and 15mins stoch indicator says enter, you still would not enter right? Until, both are good to go?

Thank you.

In your screenshot, it is showing a 2 candle entry. If it was 1 candle, the debug text would show ā€œ1xcblā€ and the extreme and CBL candles indexes would be the same value.

We can see that extreme is 0 (the developing candle), and entry is 1 (the candle to the left of 0) with the entry price the high of candle 1.

That looks correct to me.

  1. Generally yes. If I have a valid 1H TF entry, I will take it regardless of where price is in the higher time frame channel. As we discussed earlier, if we are in retracement, I will watch for a retracement trend line break to confirm the entry. Note that the majority of time, the trendline wonā€™t be broken, so that also makes a good filter.

  2. Yes, highest probability for a good trade is a bounce off the outside BB, specified by a valid CBL entry signal, and price on lower TF charts is already going in the direction of the trade, as indicated by the 15M stoch fast over slow in the direction of the trade.

I know this has been discussed before, in detail, but I donā€™t think itā€™s clear to everyone. So here it is again, the (not so) top secret trick to make all this work.

The market doesnā€™t move in nice steady 15 or 20 or 30 pip moves. We have to adapt to the market rather than complain it isnā€™t moving right. The market always moves right by definition, it may be up 7, 12, 32, pips on an upswing then a breath taking 40 pip downswing, followed by more jagged moves up again, but thatā€™s right by definition.

I think many people are trying to trade the multi-lot in nice even 15 or 20 or 30 pip intervals between lots and moving stops, and are getting stopped out. That because the market doesnā€™t always move that way. To trend trade, you want your stop to follow an up trend always below the a previous higher low, and in a downtrend stop should follow above a previous lower high.

So, to keep from getting stopped out and stay in the trend, donā€™t move your first lot to BE and put on a second lot exactly at your chosen interval. Say itā€™s 30 pips in a downtrend, wait until the price establishes a new lower high, in the neighborhood of 30 pips, then stair step your stop down and put another lot on. It may be 17 pips one time and 43 the next time, but thatā€™s the market for you.

If Iā€™m trading the 1H chart, Iā€™ll usually drop down to the 15M or even 5M chart to clearly see the new highs or lows forming. When starting in a trade, I want my stop on the other side of at least the last high or low. The CBL entry allows you to do that from the beginning of the trade. As the trade develops, I will put more new highs or lows between my stop and the price to give it more room to breathe.

Note that when Iā€™m trading the 1H chart, Iā€™m just looking for a cheap entry to a longer term trade. If I donā€™t get that cheap entry, I settle for small pips and try again. But that just suits me. Others will trade differently.

My point is, move your stops and put new lots on with the marketā€™s new lows or highs to keep from being stopped out. that might be 20 pips on one lot and 45 on the next, but thatā€™s the way the market works.

Tymen went through all this before, but itā€™s so important Iā€™m repeating it.

An uptrend is defined by a series of higher lows. As long as price stays above that series of higher lows, that is doesnā€™t form a new lower low, it is still in an uptrend, no matter what head fakes it gives you. As long as your stop is a little below that last higher low, it is still properly positioned to stay in the uptrend. Reverse for a down trend.

If you are interested in trading up to higher TFā€™s, which I always am, you will need to let price move more and so you will transition to stair stepping your stops up to higher lows on a higher TF. So when I first start a trade, Iā€™m stair stepping my stop up and putting new lots on based on higher lows that are easily seen on the 5M or 15M charts, even though I may have entered on a CBL on a higher chart TF. If Iā€™m having trouble picking them out even on the 5M chart, I may even move to the 1M chart to see them more clearly. Itā€™s just easier to see the formation of higher lows on a lower TF. As the trade progresses and I get hundreds of pips ahead, I start stair stepping the stop up and putting on additional lots at new higher lows on higher TF charts, 15M, 30M, 1H, and right on up. Of course the intervals between new lots also increase proportionately. Thatā€™s what makes this all work, for me at least. Try it, itā€™s great fun :smiley:

Hope this helps someone. Happy trading.

tHANKS gRAVITON for the explanation!

I have a question:
If you are swing trading, what time frame you use to place the Stop loss?

thanks!

Iā€™m not sure Iā€™m clear on your question. I think you mean which chart would I look at to adjust my stop levels. If so, itā€™s not always the same chart. For instance, at the very beginning of a trade, I will be running a tight stop to reduce my entry risk in case of a quick reversal. So Iā€™m looking at shorter TF charts to stair step my stop up and add lots in tighter intervals, like 30 or 40 pips. As the trade proceeds I widen the stop, first by letting it run say two higher lows on a 5M chart, then moving to the 15M chart and on up. You will usually at least move one timeframe down to clearly see the higher lows and find a higher low that is near where you want to move your stop to. If you canā€™t see it, move another TF down where you have finer detail and look there. It takes a little practice, but moving stops by stair stepping them, up in the case of an up trend, from beneath one higher low to the next will greatly improve results.

:

Thank you :smiley:

Ok thank you for your explanation! Iā€™m pretty clear of whatā€™s going on for now. :slight_smile:

Hi Graviton,
would you explain how to make trade and enter please
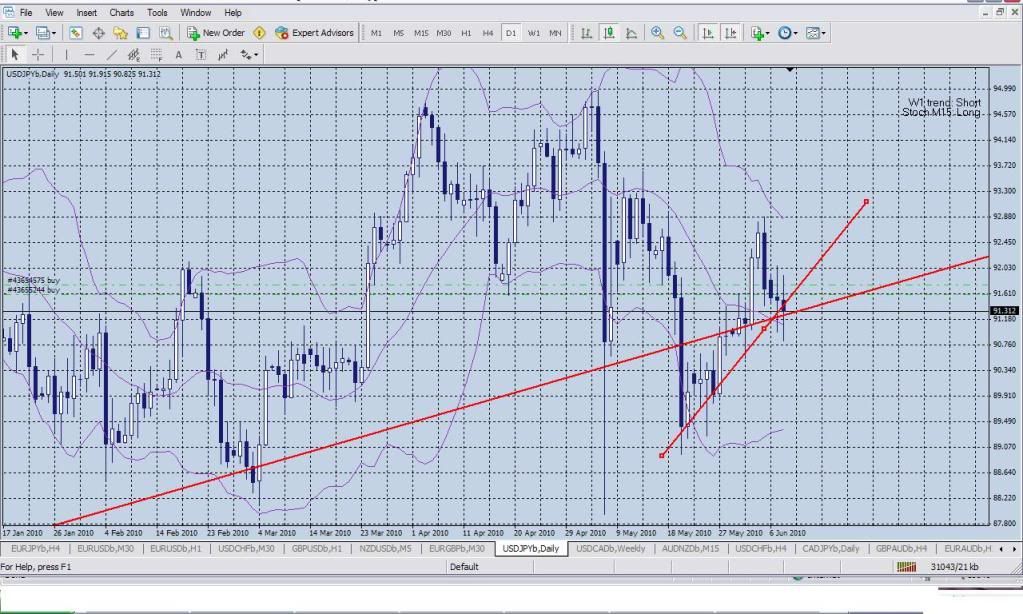
right now ujā€™s PA is crossing daily retracement trend line, but its right now.
it can be change to dojy candle by the end of the day? (what tf chart would you use to enter, will you wait until the next day for the candle close
would you wait for few days as PA can go up and down when crossing trend line ā€¦ ???)

Other question is why you look everyday how the London session is open
how its related to the managment of long position trade or swing trade?

you said somewhere in your post that
you enter off the H1 chart for long position trade. I wounder woudnt you stoped out by H4 retrace?
I was tring to enter off the 30M chart and was following PA until H4 retrace has hit my stop ?(well it didnt I closed with some profit but it was no way to keep the trade for long position trade)
I dont sure if you can be stop out if you enter off the 1H chart

thanks

Please show me a chart so I can see the same thing you are seeing :cool:

Here we go
red short trend line :cool:

well, I must be drew retracement trend line uncorrectly
but anyway in case it is crossing Daily trend line

OK, I see what you mean now. The break of the retracement trend on UJ daily is a good trade signal. I would check to see the 15M stoch and the 1H stoch are headed down at the moment of entry, just to confirm youā€™ve picked a good moment to enter.

I just look at the london open to see which way the big traders are trading pairs. Often big traders will take a position and hold it the whole session. So if say gbpusd id going down at the london open, Iā€™m more likely to take a short position. Itā€™s just one of many things I look at each morning.

If I can get a good 1H short entry on a pair that has a good daily short chart, I might get in the daily trade with a smaller stop. Iā€™m always looking for a cheap way to enter a long trade. Yes, you might get stopped out of a 1H entry before the daily trade can develop, but if you make a good entry on the 1H chart, you should actually make a few pips for the effort, and you can then just take the next good entry.

Note that for the 1H entry to be good for me, the H4 would have to be moving in the direction of my trade. Yes, if the H4 retraces you will get stopped out, but in that case you wouldnā€™t have wanted to enter the daily chart trand anyway, so you got out at much less than a daily stop out would cost you.

Yes, you might get stopped out of a 1H entry before the daily trade can develop, but if you make a good entry on the 1H chart, you should actually make a few pips for the effort, and you can then just take the next good entry.

how I can make a few pips ? If I had enter off the H1 chart and when retrace of the H4 chart is start forming I would need to close the trade with some pips or I can wait until it might stoped out or may not.

If I will closed the trade at H4 retrace I will get some pips but I will miss the good entry. But the problem is that at time when retrace is forming I dont know yet will it hit my stop or not so I dont know what is better to do close position with some pips or just wait and see if it was good position to enter.
well, is it understandable? :slight_smile:

but I can confirm the break only when the daily candle closed. So I have to wait to next day. Right?

I just look at the london open to see which way the big traders are trading pairs. Often big traders will take a position and hold it the whole session. So if say gbpusd id going down at the london open, Iā€™m more likely to take a short position. Itā€™s just one of many things I look at each morning.

they just take it for one session (for a day)? How do you see it?
when the candle opens it first go for some retrace and then in the direction of trendā€¦ hmmm :confused: