unexpectedly, I am looking at my chart with ‘yours eyes’ - you have gave me some ideas to think of
thanks
btw, the way I trade the squeezes makes 20-40 pips off the small tf in just a few minutes depend on the pair and I like it. This how I made 100 - 120 pips a day with only one lot(sometimes two lots). But I would need some confirmation of course to avoid that loosing trades I did on friday.
if you can think of some please let me know
Also I would like to avoid long squeezes somehow, maybe I should look at high TF for some signs of a long squeeze on the lower TF
I dont know yet
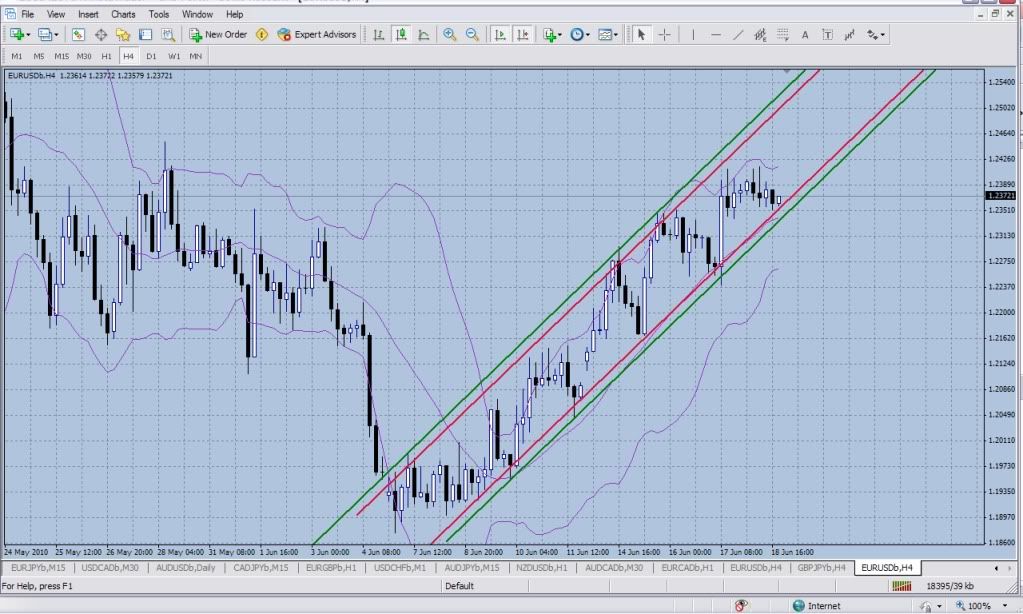
Graviton, I have wrote trading plan to trade eu on monday.
PA has closed by daily trend line. Watch 15Min chart to start the trade to enter long at bottom band @ 1.2360 which is good cbl entry to go long off the H1 chart.
TP1 at 1.2415 which is Upper band on the H4 chart.
Well, I can still keep this trade if PA will continue to walk the upper band.
second trade
watch 4H chart squeeze to set the second trade. If PA breaks the daily trend line then enter short at middle band, keep the trade at list until it reach 1.2190
Actually looking at daily trend line and the squeeze that is forming on H4 chart. It looks like PA almost bounced off the daily trend line. If it does its a good station to enter with the second long lot.
what do you think? can you sugest any improvments?
thanks
I’m doing some study on trading breakouts right now myself. There are many methods and techniques that have been developed over many decades with trading breakouts. I suggest you do a google search for trading Forex breakouts and learn everything you can if you want to trade these setups. With what you already know and just a few months of study and practice, you can get really good at this. As you said, the risk reward ratio can be very good on these trades.
The biggest problem with trading breakouts is what is known as the false breakout. That’s when price dives through the Bol band and reverses back up just as you enter your breakout trade. That is how you lost on Friday’s trades.
As I noted earlier, if the price reverses back up and gives a valid CBL signal, there is about an 80% chance it is a false breakout. If you immediately exit those situations, you will be right 4 out of 5 times and save yourself lots of pips. This would have worked very well on the trade you showed me on your chart. So that’s one powerful method to avoid losing lots of pips on false breakouts.
Another thing we’ve talked about a lot here is trading with the higher time frame trend. Often what looks like a breakout on a shorter timeframe is a reversal of price back to the mid BB on a higher time frame. Those are high probability trades since price is more likely to return to the mid BB once it’s moving that way than reverse and move away from the mid BB. Once again, a valid CBL on a higher time frame moving the price back toward the mid BB is often seen as a breakout on the lower time frame.
I’d have to see charts of your other problem trades to see what can be done about them. Usually there are good rules that can be implemented to improve your win loss ratio. Of course, in any system that has a very good risk reward ratio will usually have a lower win loss ratio, so trading breakouts you will still have to take many small losses to make a few really big wins. The goal must be to keep those losses as small as possible so that the big wins put you ahead overall.
If you are going to trade breakouts, there is no need for you to get involved in a long squeeze and wait hours or even days for a breakout. Just wait for the current price candle to be completely outside the old range that was established before the move started, and then enter. I often draw horizontal lines to show that range on the top and bottom so it’s clear to me when an entrie candle is outside that range. That keeps you out of the many small moves where price dips outside the BB for a bit and then quickly returns back in, creating a whipsaw if you enter too soon. Remember that in trading breakouts, you want to capture the few big moves and ignore the many small moves that would only create whipsaws.
Another really good set-up that works for me is to draw in retracement trend lines and trade the break of the retracement trend line when price moves back to resume the main trend. This is very high probability trade since their will be many retracements in any main trend and only one retracement (the last one) really signals a reversal of main trend. Once again, when the retracement trend line is broken on a higher time frame, it will usually show up as a breakout on lower time frames.
You will need to study these techniques and many more to become proficient at trading breakouts. But if you want to follow that path, you want to know everything there is to know about it and be the best breakout trader in the world. A I had said earlier, just type trading breakouts into google and start reading and practicing. With a good trading plan, study, practice and good tracking of your results, you can master this technique in a short time. Of course, it will take much longer without doing the above things. Happy trading.
I’ll enter EU long as soon as I’m convinced we are making another swing up, probably very close to where we are now. I’ll want to see a few more lower TF candles after the open though to make sure it won’t turn down on me right after the open. I’ll be looking to make about 85 pips off that long trade and exit after I make the 85 on the first sign of slowing upward momentum.
I’ll then wait until price reverses and heads back down and go short right about where I exited the long, around 1.2455 and ride the short until it makes it back down 85 pips and exit after that at the first sign of a stall in downward momentum.
If price doesn’t reverse back down, I will re-evaluate my belief that the Euro is going to parity and decide if I need to make a new plan.
And yes, if price breaks down through the 4H mid band I would consider it a break of the retracement uptrend line and a return to the long term downtrend and I would go short and look for about 300 to 400 pips profit.
Just wanted to bring you up do date on my swing/position trading thus far. Since I have been gone quite a bit lately I have not been able to watch pairs as closely as I would have liked but I had been keeping and eye on USD/CHF weekly chart as a good CBL set-up appeared to be approaching. I took the trade short on the 16th at 1.1275 which was a little later than the CBL would have had me in but per your advice I was waiting for confirmation and got it with the break of weekly piviot points and fib levels. (3 good reasons) I’m up 184 pips right now, back in town and ready to hopefully add on more lots as setups allow. I have a trading plan and purchased a terrific excel spreadsheet journal for $47 that calculates all you want and more to track my progress. Thanks again for your continued advice and input. Much appreciated.
If you want to see how I came up with the magic number of 85 pips, draw a channel on the H4 chart across the tops of the retracement trend channel and across the bottoms of the channel for the last 10 days or so. It should be about 195 pips wide.
Now, we draw an inside channel. A channel within a channel, with the bands a little tighter together than before. The bottom inside channel trend line should include every turn back up of price. Some will turn right on it, and some about 70 pips below and then pass back up through it. The top inside trend line should touch every turn back down in price, some will turn just as they touch it and others will go about 50 pips higher, then come back down through it. The distance between that lower inner channel band and the upper inner channel band is about 105 pips. Allow about 10 pips on top and bottom to make sure we don’t miss a turn, and we come up with an 85 pip distance between entry and exit.
So the trade has three parts, a swing up for 85 pips, where we enter as price moves back up above the bottom inside channel and exit as it hits the top inside channel line. Than a turn back down for another 85 pips, entering short as price crosses down below the top inside channel and exiting as it reaches the bottom inside channel trend line. That may happen once, or even repeate the cycle twice, but eventually the swing down should blow right through the bottom outer channel trend line and continue downward, back to the major down trend, which is the last part. The whole trade never risks more than 35 pips, and that’s only if it moves right at every turn. If it doesn’t, I just don’t enter it. If it does, I’ll make 500 to 700 pips on a 35 pip risk.
So that’s my suggestion to improve your trade. Don’t risk too much on it. If it works, great. If it doesn’t, toss it out with yesterday’s rubbish and move on. Happy trading.
Noticed you would get stopped out if your SL was too tight in the 1 hr TF.
For me i would take this as a swing trade, and place my SL at a previous low.
This way if my SL gets hit, i know the trend is over as a trend only has higher highs.
However if you had use tymen macro method of 3 candle cbl entry, the SL wouldn’t be an issue at all
Ah, that’s a great entry! Yes, the old find three good reasons to enter a trade rule. That’s a good one. I can’t remember the last time I lost a trade where I had three good reasons to enter. Now the next part is a little tricky. The USDCHF daily ATR is 140 pips. That means on any day you could get hit with a 140 pip retracement. There will be a retracement. There always is. Perhaps it will happen right around the 100 week moving average. Perhaps somewhere else. You have to be patient and just wait for it. It may only last a day, or it may run for two or three days or even a week.
If the retracement comes soon, you plot a retracement trend line on a lower time frame and just watch as price moves up the retracement trend line. When price breaks the retracement trend line and resumes the main trend back down is when you add the next lot with stop loss just above the new lower high formed by the highest point of the retracement. You will need to consider carefully what that stop should be. Perhaps in the neighborhood of 1/2 ATR, or about 70 pips. Then you follow the main trend down and wait for the next retracement and do it all over again.
If the retracement doesn’t come soon, you’ll be tempted to just go ahead and put the next lot on anyway. Let’s consider the worst case of that first. It’s always important to consider the downside of an action before considering the upside.
If a 1 ATR retracement comes now, you would lose back 140 pips before it turned back down. That’s not good, but it could be worse. If you put another lot on now, and you go into a retracement, price only has to move back up 90 pips and you will have lost all your profit. of course, if you put the second lot on with a 70 pip stop loss, you would really only lose 140 pips in that first 70 pips of the retracement, but you could easily lose the other 40 if a retracement of 110 pips completes.
So how many pips must price move down, before you can put a second lot on and not lose all your profit back on a 1 ATR retracement. That would be 2 X 70 pips until the first stop loss is hit for a loss of 140 pips, plus another 70 pips to get to a 1 ATR retracement of 140 pips. So that’s a total loss of 210 pips lost on a retracement of 1 ATR = 140 pips.
So my conclusion is yes, you are very close to putting a second lot on. Worst case indicates a break even for putting a second lot on at a profit of about 210 pips and a 1 ATR retracement. I always like to add about 10% to these calculations as they are just approximations, so I’d advise putting a second lot on with at least 230 pips profit on the first lot, that is if a retracement doesn’t start first.
Now a word from experience. My usual target before putting on a second lot is 300 pips. So there you have a range, the second lot might could go on somewhere between 230 pips and 300 pips.
This is all just an example of the considerations to make before putting on another lot. Fortunately, you have plenty of time to think it over. There are many things to think over, trend lines, moving averages, ATR, Fib levels and lots more. But you’ve made a good start and I wish you well. Keep me posted as to your progress and happy trading.
thanks, its very interesting reply I was studing. Please verify some things for me
I cant understand the defeniton between ‘breakout’ and ‘break’. My guess
breakout is when the candle complitly out of the old range, but the break is when candle has crossed the range level. Like candle’s open is in old range but the candle’s close already in new range ??
say, we trade daily retracement trend line breakout. should we wait until the candle’s open and candle’s close are in the direction of the main trend and there is no touch with retracement trend line?? then the entry is on next candle open? where would be good to plase SL?
I heard somewhere Bol trades or something like that, but I didnt ask what is it?
so what Bol band is? actually I dont understand what Bol is ?
I do drow in horizontal lines of the daily range.
what TF do you look at and wait for entire candle to be out of range?
or DO you wait for entire candle out of range on your home chart?
I’d have to see charts of your other problem trades to see what can be done about them.
its really nice. thanks
I’ll look at my trade terminal. I guess most of my problem trades with false breakouts that we have already discused.
Other one was when I have entered on divergence indicator signal.
So now I would use this indicator only like confirmation for cbl entry. Not sure if its good or not. At the same time I think that I could loose good entries if would wait for such trade confirmation.
I had one margin call at the retracement, when I got about 8 lots running in the direction of main trend. It was not enouth only one pip to continue to stay in trade. kind sad …
I dont know if I will able to restore chronology of this trades, I dont keep the records.
This study of my friday’s problem trade is very usefull, I did some new rules to trade squeezes and things to pay attention to. I am very appresiate your Help Graviton. thanks
btw, I’ll continue to study on squeezes trades as its good and fast pips.
No problem working on your trades with you. I promised at the beginning I would work with you until you are a world class trader. This is no minor commitment of my time. I must ask that you also commit your time and effort to start recording and tracking your trades and analyzing them in a trading journal. Look at it as the price you must pay for the free schooling. You should track all the statistics I have mentioned before and carefully keep up with info as to why you took trades. Put notes and mark-ups on charts and put them in your journal. I can’t do this great thing unless you help me by doing your part. Don’t give up on this journey, work harder to achieve your goal and I’ll work harder as well.
Now to your questions. When I talk about a break of a BB or Trend line, I mean price just crosses it, or even more certain, price closes on the other side of it. That could be considered the first sign of a breakout, which is where an entire candle will move outside the trend line or BB, but we have to be patient and wait to see if the move will be a true breakout and not reverse and become a false breakout.
The most certain way to enter a breakout is when an entire candle has formed and closed outside of the trend line or BB. You may enter earlier if you have good confirmation, but the less confirmation you have, the more trades you can lose. You’ll want to place the stop loss at a point where the trade has proved to be wrong. That would usually be just on the other side of the previous higher low for a breakout up. That will also usually also be back on the other side of the trend line or BB that was broken, which is another indication that the breakout has failed. Also, your stop should be of some minimum size to handle the noise at that time frame. That’s usually about 1/2 ATR, more or less.
Bol bands is just short for Bollinger Bands.
The most sure sign of a true breakout is when an entire candle is outside the band or trendline. Less sure is when a candle just closes outside the band. That should have additional confirmation.
Yes, divergence should only be used as confirmation of a trade signal. It’s not reliable enough to be used as a trade signal by itself.
There are 10,000 good entries in some market somewhere every day. You will miss most of them. If you worry about every missed good entry, that’s a lot of worry. Never worry about a missed good entry. Instead, worry about making the entries you make good ones. That will require tracking those entries with good stats. I won’t be able to help you much if you don’t put in the effort to keep good stats.
Don’t be too aggressive putting on additional lots. Putting on additional lots is a very big and powerful weapon in trading for a living. Use it carefully and with great respect for its power. [B] Never put on an additional lot if it will cause a winning trade to become a losing trade if price retraces.[/B] Price will retrace, so be prepared for that to happen at the very worst time. Prepare for the worst case.
As I said above, the price of my helping you is you start a trading journal and keep good notes on your trades and do good analysis of stats on entries and trades. In the end, it’s a small price to pay, but resisting me on this will only delay your progress. So start your journal today. I’m old fashioned and keep my journal in a looseleaf binder, but many now keep them on their computer. Just make sure you have back-ups in case your hard drive dies. Happy trading.
The difference between your channel lines and mine are the wicks. I included the wicks in drawing my channels, since they will also trigger a stop loss. If you include the wicks, both upper and lower outer channel lines will move out some. The upper inner channel which represents the take profit line on a long trade and the entry point on a short trade will also move up some, and you will need to add a bottom inner channel line that represents your entry point for long trades and your take profit point for short trades.
You’ll need to track both negative and positive trades. Of course, there is more to learn from negative trades than positive ones, but upon entry, you don’t know which is which. You’ll also start to see some patterns in your winning trades over time. Like one entry method produces a better % of winning trades than another. It’s lots of hard work, but it pays well
Unfortunately, I don’t know any way to be successful at this business without putting in all this hard work. Sorry about that
There is no way to know that ahead of time. You can know that the vast majority of retracements are temporary and that price will return to the major trend eventually, but you can never know ahead of time which retracement is an actual reversal of major trend. Of course, once a new lower high isn’t established in a down trend, that is the next high is higher than the last lower high was, it looks like the trend is broken. You then have to go to a higher timeframe to be sure. It may only have been a small retracement on a higher timeframe and the major down trend may still be intact on the higher time frame.
That’s why you trade only with the trend. If the retracement against a major down trend is going up, you only have two choices, trade up with the retracement, in which case if it is the last one of a series of retracements that turns into an actual reversal, you are trading in the right direction already, or your second option is you wait until the retracement trend line is broken and trade back down with the major trend, in which case you are also trading in the right direction. It’s another reason I like to trade with channels. If price goes outside the major channel in a retracement, there is a much higher chance it is the actual reversal. I can take profit at that point and wait and see if price comes back into the channel or if it turns out to be an actual reversal.
I’ll usually plot those channels on a lower time frame and exit to pocket as much of my profit as possible as soon as price moves outside an established channel.
Im still struggling with entry points,i look at chart…cbl 1H or 4H entry - check…price going in direction of trade…check…i place the trade…whipsaw and SL.Then nothing happens for 2 hours.I dont look at it for 1 hour and it gives a good entry and moves or i look in the chart and always the best entry seems to have happened 1 hour ago,but the entry still seems valid.When i try to join…whipsaw and SL.It feels that i need to look at it all day to catch the moves.
Thats why i tried to use big SL last week,my only sucessful trades happened with 100+ pip SL.
Over the past few months I’ve been lurking and casually following your thread. This past weekend I had a chance to read the PDF “Gravition Final” aka “THE BEST OF GRAVITION’S THREAD”. [I][U] KUDOS! to who ever assembled it! [/U][/I] Reading and studying the info in the PDF I really started to understand your trading methods.
The information you’ve shares is priceless. I want to thank you for taking the time and effort to pass along your knowledge and experience.