My automated trading experience

Hello,

I started trading three years ago mainly as a hobby data analytics project, as I’m always messing with code.

I use automated trading, it works for me (with some worried moments), and I’ve seen some interest so thought I would outline my process for anyone interested. It could be total rubbish, so please take it with a pinch of salt.

I have two systems, both written mostly in Python and C, running on the AWS cloud to ensure good connectivity.

Here’s an outline of how it all works.
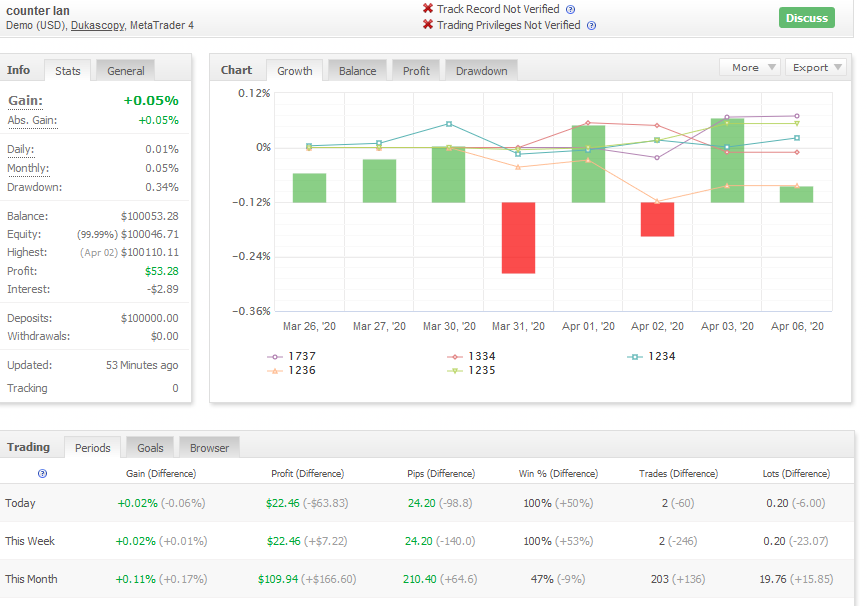
System 1:

  • Each Sunday it downloads the S30, M1, M5, M15, H1, H4, D price data from the previous week, adding it to a database of pricing data. This database keeps at least six months data.

  • For each Forex and CFD pair (about 93 in total) it will update a number of parameters such as:

    • Recent volatility over x, y, z days (e.g 1, 3, 10 day volatility as a percentage of price)
    • Return per pip at the current XR for a given margin (to understand the best value pairs to trade)
    • Volatility and price movements at key times of the day (London, NYSE opening for example)
  • Using these updated values it will then go back over the past 6 months and simulate trading on an number of fairly simple strategies, such as SMA crosses, and adding various indicator values at the time of each trade (RSI, MACD etc.). It’s a computer, so it’s able to test a LOT of strategies - typically in the region of 1000 - 5000 different strategies, which are simply combinations of crosses and indicators.

  • It produces correlation matrix of loss / gain per trade and indicator value for each strategy. It notes the median levels of gain and loss - these are really important.

  • It selects which pairs to trade on the basis of recent volatility and return per pip for a given margin.

  • Finally it selects the strategy for each pair based on what came out of the analysis.

  • It will then trade the following week on this strategy.

  • When it trades, it uses an adaptive SL / TP, which is based on the statistics it has collected. Often it has a very deep SL - which goes against general advice - but more often than not the trade recovers into profit, even if it takes days. This can lead to some hairy moments.

  • Likewise it will dynamically adjust the TP based on analysis

Last week it made 38 trades, and 29 were successful. A successful trade usually gives about 70% of the return that an unsuccessful trade loses.

Where it struggles (or I do with the coding and general lack of knowledge) is in ranging markets. It (or I) struggle to correctly filter these out. That is a WIP.
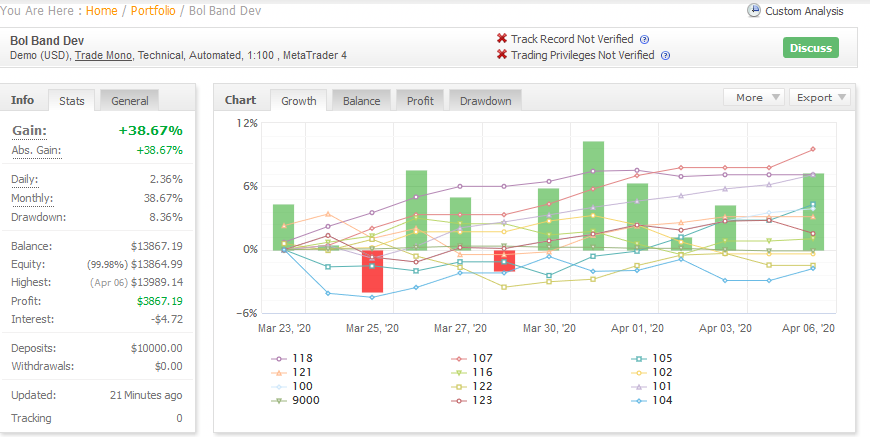
System 2:

This is actually very simple, and a well known strategy.

  • The program has with a window, say +/- 30 pips.
  • Imagine the price crosses -30 pips
  • The program will sell and set a mid point of the purchase price. Now the window is moved, and the TP is +30 pips, the SL -30 pips.
  • If the price crosses the TP, the window is shifted gain. Now the TP is +60 pips and the SL 0 pips.
  • This keeps going until the price reverses and crosses the SL.
  • When it crosses the SL it will close the current open trade and make a trade in the opposite direction and repeat the process.

The overall effect is that it ‘walks’ up and down movements, and it’s very effective in volatility. See Oil last Thursday when it boomed 10$ in a few minutes…

Deciding the window:

  • The program has a database of tick data for all pairs
  • At the start of each week, it simulates all pairs using windows of different sizes, converging on the best setting per pair.
  • The top X pairs from the analysis are picked to trade for the week based on success from the sim of the previous week.
  • These are usually indexes!!!
  • It out-performed system 1 last week, much to my disappointment, as it took about 30min to code (as opposed to weeks)

Anyway, above are my approaches to automating trading, as I’m utter rubbish by hand.

HTH someone who’s interested.

2 Likes

wow the first system sounds devilishly complicated! Hows it perform?

I made a bot very similar to the second system and its pretty good. forward testing a few variations atm It doesnt double the sl,tp. It just trades blindly setting the new centre to the last close.

1 Like

Hi!

I think my description of the second one was maybe a bit confusing - it doesn’t double the window, it shifts it.

So similar to yours, I think, but on the live price.

The windows are calculated back testing tick data for the last X days.

The first system looks more complex than it is - in essence it is trying to unsertand what the llikely ranges and behavious for a given pair are.

In terms of performance, it has had one week of loss and several weeks of gain.

I am not conviced long term, however.

I think fundamental analysis trumps technical - just look at today at the GBP and JPY - PM ill and state of emergency. Nothing technical will foresee that.

I think your idea and my system 2 are probably the best way to go.

oh ok. shifts it … i get it… I stumbled on this by accident. Was testing another strategy and just found this idea. It just sort of predicts the oscillation really well. no indicators or anything, just resets it centre at the end of each closed trade. so simple and easy.

The only thing i am live trading is a Bolinger Bands deviation strategy. its nothing fancy either. The trick with it is the time of day that it runs. I run multiple versions of the EA all for different hours of the day on different pairs. Have been running it on and off for years. Its sensitive to time and daylight savings, shifts in times. I continually run demos to ascertain the timing. Running 72 ea’s on each demos just to keep track. i track each one on myfxbook.
pic is one with 12 ea’s each for a different hour .

Very nice!

One thing maybe worth bearing in mind is some kind of protection vs the live price if you just use the close price. (not sure if you place a SL or not - I don’t but use the live price)

There can be some really odd spikes now and again!

Agree with the constantly running demos - I have a virtual instance on AWS that is dedicated to exactly that - churning through the data and updating the settings.

The bots then pick the settings from a database as they trade.

Is that interface you sho your own developed dashboard or something you purchased? It looks nice.

I made my own web portal for the bots, but the styling is not as nice as yours!

I have always known about automated trading but don’t have a clue where to start! I’m not a computer whiz at all, are you running any automated systems live? It just seems like the perfect way, everything hard about trading is psychological, so just remove it! Do you know where I could start?

Hi!

Yes, the two systems I run are live and automated.

There are two approaches, as far as I can tell.

  1. Use an API provided by a broker - most of the main brokers provide a REST API.
  2. Write an Expert Advisor in Metatrader

I’ve done both, although I much prefer (1). Using Python with ittle code you can perform complex, fast analystics, database operations, run web servers etc.

The bot runs on Amazons’ cloud service.

However, getting started is tough to answer - it depends what you want to do.

If you want something that trades according to a few signals, than probably start tinkering with an EA, I guess?

its not my dashboard. Its myfxbook.com . Just use if for analysis. i just trade with mt4

Do you have a myfxbook.com account to take a look at?

Ah ok!

This is what I’ve built, I’ve had to redact a lot of the information as it’s my real account, but you get the idea.

It’s all a single page app, the top is the summary…

Web12

Open trades and closed trades follow, here are the first few closed trades… it trades very frequently, typically with 4 - 12 trades open any one time.

Web1

And finally there are about 12 charts that have some analysis of the live situation that the bot uses and I can take a look at (such as volatility and things like that)

They all look like this…

Web13

It’s not brilliant, but it works on mobile and desktop and does the job.

No, I don’t, I tried to build my own system :slight_smile:

Can I volunteer to test them?

You’ve seriously gone to alot of work with that app! where do you get the data from? mt4/5?

Here’s a demo account i am currently running. It’s running every time variation (hourly), so its not going to be overall positive. analyze it by magic no’s to see the profitable vs unprofitable.
http://www.myfxbook.com/members/arbus/bb-hot-test/5251881

I use REST APIs for the data, most of the big Forex brokers provide them.

Usually you can stream the price data live, get candles for various time frames and trade with the APis.

It makes things very flexible, and crucially for me, I’m not bound to some else’s application or OS.

1 Like

Very nice. I can see the USDJPY issues - my program has had issues with that pair this week also :slight_smile:

It has a really low SL (SL is about -300 pips at the moment), so it might actually recover and take some profit later in the week, but for now it’s well down.

Thank you for the post!

I am interested in your use of simulation to define the system parameters at the start of each week. Have you found that it improves system performance vs hard-coding the parameters? Do you find that the setting change much, from week to week?

I am also curious about the median loss vs gain metric that you mentioned. My guess is that you look at the median across a range of parameters so that you can get a more robust solution?

I started much in the same way as a hobby data analytics project. For awhile now (2 years) I have been coding and building trading systems in python, running lots of demos to observe performance characteristics and analyze the data - but not yet consistently profitable. I am currently running about 9 systems across 28 major pairs on an old home server.

One system I have been excited about is a simple trend based breakout system with progressive money management technique. Position sizing starts tiny and slowly increases until there is a loss. That MM technique is designed to work well for systems with good ‘clusters’ of wins and losses. Entries are similar to your system 2 where it walks along with the trend, except on an hourly basis. It seems that overall it really hits when good directional volatility picks up, as it did recently in March. I generate web pages for analytics and push them to a bitbucket server so I can access it where ever.

For each system I have two pages. Page one is an aggregate view across all 28 pairs for the account, and the next site link breaks downs analytics per currency pair. I am also starting to monitor aggregate fx volatility to use as a on/off switch for systems.

Thanks for sharing your experience. I like to see that there are some other coders out there that aren’t strictly using EAs :slight_smile:

TL,DR : I try to make the system find its’ own settings. I give it the ideas. But I’m not convinced this beats a manual, fundamental approach.

Have you found that it improves system performance vs hard-coding the parameters? Do you find that the setting change much, from week to week?

Yes, very much so.

I never hard code parameters.

The simulation works like this…

Let’s imagine I have a new ‘idea’ - when MACD crosses down, I am going to sell. This is just a hypothetical example.

The MACD itself has three settings, default usually 12,16,9

The simulator will then take historical data for a preset period, say one year, and for each pair (Forex, Commodity etc) will start to run with the settings. It keeps a record of each trade and various stats about the trade - means, medians, stdev, etc. At the end of the test it has a ‘result’ - pips gained or loss.

Then, it will change one of the settings and repeat. It’ll compare the result to the previous result and decide whether to keep the setting or not. The idea is to converge on the best settings for a pair for a given scenario.

It would look like this

MACD 12,26,9 -> 2019 Pips Gained -210, trades 30,000
MACD 13,28,9 -> 2019 Pips Gained -220, trades 30,100 : worse, reject
MACD 11,28,9 -> 2019 Pips gained -190, trades 29100 : better, keep
MACD 11,27,9 -> etc, etc etc

It does this for each pair (about 90 of them), and selects its’ trading parameters from this.

Of course this leads to a lot of tests (can be over a million), I have two 8 core Ryzen computers and they get through it pretty quickly (Python allows easy parallel computing)

What is ‘hard coded’ is the original idea. The system is left to find the best settings.

The reason the median is often so important is when running these tests you often get lots of poor trades and the odd very good one. This gives a high mean return per trade.

I tend to use the trade results to set SL and TP at the start of a trade (They often adapt during a trade), and thus using the median often provides a better idea of what to expect.

Another anecdote:

I have back tested a huge amount of the ‘forex education’ systems we see, and none work long term. It’s simple fact.

I’ve also watched a lot of YouTube videos that claim all sorts of scalping success with simple patterns.

Again, it takes my setup a few minutes to run these through a year of tick data, and none of them are for real. It makes me really mad, as they are taking people for a ride.

There are, however, some pretty simple ways of trying to make a profit if you think out of the box a bit - much like the walking method (although there I have found you need a certain level of volatility and the window you choose need to be adaptive or very specific to a pair).

There are some others as well. For instance, taking March 2020 out of the equation, you find that the price of most pairs is quite cyclic.

So taking 4 hour or day charts, stripping the data down to the major maxima and minima for a given period, you can do something dead simple like ‘if we are near a maxima, sell’. This works oddly well (you need to find the right period etc, but you get the idea)

Lastly (sorry for going on) to your point about settings changing.

Three weeks ago, my bot had a bombastic week. It returned nearly 50% of the value of the account. I was stunned. The beach beckoned.

Then I found a stupid bug in the code where I had forgotten to undo a test I made, and it took its’ settings from before November 2019.

I reran the settings including March 2020, they were different and the bots’ performance would have been far worse than it actually was!!

This scared me a bit - I don’t believe in arriving at ideal things by chance.

All said and done, I am 50/50 on the success, and I’m tending towards feeling that fundamental analysis is better.

Take last week, for example.

Monday, Japan announce an emergency. I just shorted JPY pairs.
Then USD was weakening against everything. I saw that and the news, I just shorted all the major USD pairs. Simple as.

Sorry for such a long reply, hope it helps a bit.

PS I use Bitbucket as well :slight_smile: Git has saved me many a time

1 Like

Thank you for the response and further details. You are giving me ideas that are added to my own R&D backlog lol I need to get to work! Scary bit about the bug in the code.

I got slammed on JPY trades in October 2019 (I think it was october?) when Core Machine Orders came out so I tried to address it. A previous idea that I had for addressing fundamentals/news was to write down all of the high impact news events (pulled from the Economic Calendar on this site) into a csv file every Sunday night for the upcoming week. Then my system would check for upcoming news and exit any existing trades or reduce positions depending on what was coming up.

It was a quick and dirty implementation, so I found that I didn’t have enough research behind it to really make it useful. Like which events were most important, how far before the event I should exit a position, etc. For instance it sometimes it felt like the upcoming news events would actually cause a trend up to an equilibrium point, and the news release would cause the tension to break in one direction… if it was a surprise. I wonder if patterns of your simulation selection parameters could be observed given the recent & upcoming news events. This news research is something that’s on my to do list, but have been thinking about ways to address the fundamentals. I guess ultimately it still doesn’t really help in the case of emergency news releases like we’ve been seeing…like you pointed out.

I think I’ll go write some simulations in python now :slight_smile:

Hey, thanks a lot for the detailed post.

Just trying to understand your second approach, am I correct that you are not entering until your initial +/- window is hit? Sorry I’m probably missing something! You mention it’s a well known concept, does it have a name I can read up on?

Sounds like: define your window +/- N from current price, go long/short when either +/- hits, set TP/SL to +/- N from your entry, shift the window +/- N from where you just entered. Rinse & Repeat. Not too sue either what you mean by set a midpoint.

Are you entering a new trade at the same point your TP/SL hit? I guess that sounds a bit martingale like?

Thanks :slight_smile: