Thank you for the update. I appreciate…I am glad Phil is around for us…
All the best to his Masters Education.
Thank you for the update. I appreciate…I am glad Phil is around for us…
All the best to his Masters Education.
I understand that Phil is away, but I’m sure there are other traders who can comment on my Scalp Lines, Trend Lines, and S/R Zones. I tried creating another topic on the Newbie Island Forum but it didn’t catch any responses. The two charts are both four hour, GBP/JPY Charts. Any help is appreciated.
Thank you MattW2009. I take it you are trading Phil’s method now? A few more questions, as this is the only place I can really ask.
Is a trend-line only valid if it has three or more bounces? If this is the case, it seems difficult to always find clean trend-lines?
Also, do you trade pairs besides GBP/JPY? If I were to post my lines for the EUR/JPY and the GBP/USD, would you be able to evaluate them? Sorry if this is a burden, just want to make sure they are properly placed.
Hi SlikRick,
First off, sorry for not getting back to the PM you sent me a while back. I read it but was having a really busy week and then I forgot about it. Sorry… 
I agree with Matt on the S+R zones… they look great. In my opinion the upper trendline does have 3 bounces. The third bounce isn’t perfect, but it’s certainly close enough to call it a bounce in my opinion.
Here are a few notes I drew onto your pic…

Yes, a trendline needs, at minimum, 3 bounces, but that doesn’t mean you should never draw 2 point lines on your chart…

Welcome back Phil. Very happy to see you back.
Regards,
Muthu.
Appreciate the advice Phil, I have a much better grasp of trend-lines and how they’re drawn now. We miss you dearly on these forums, its good to see you back.
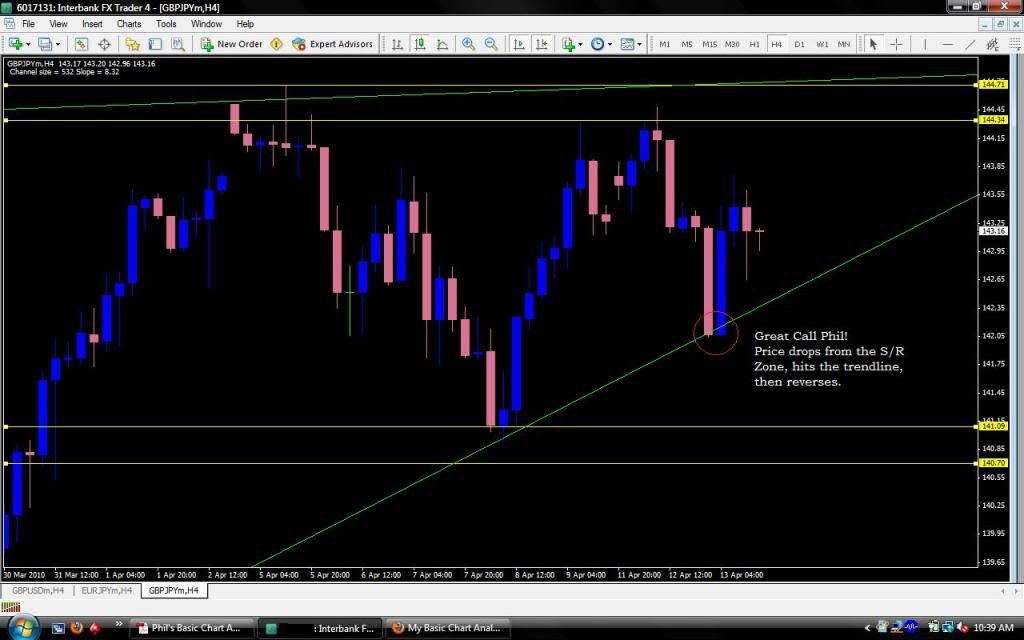
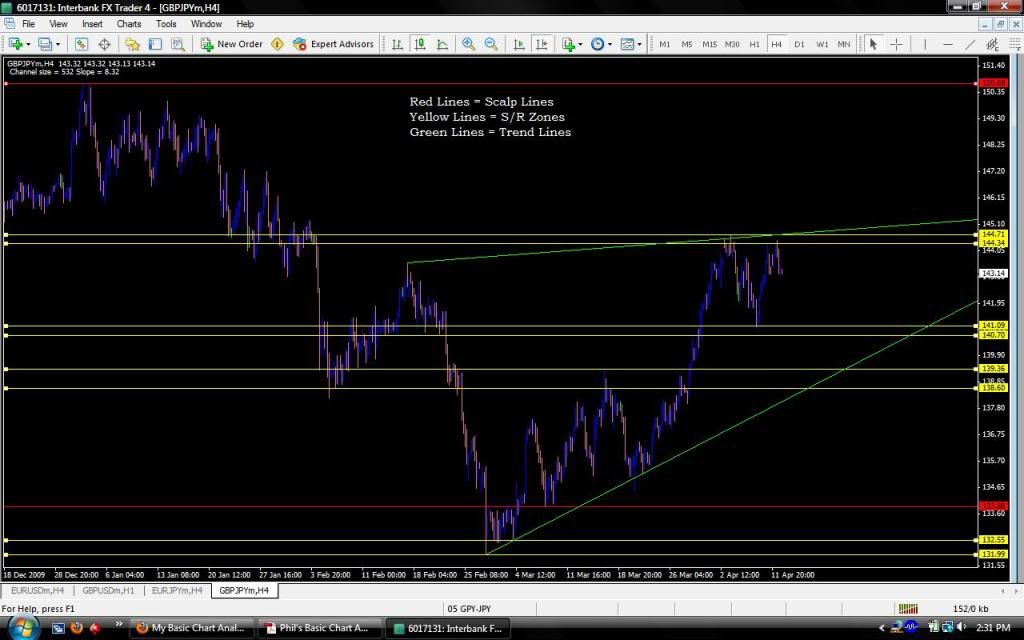
Also great call on the previous trend-line on the GBP-JPY:
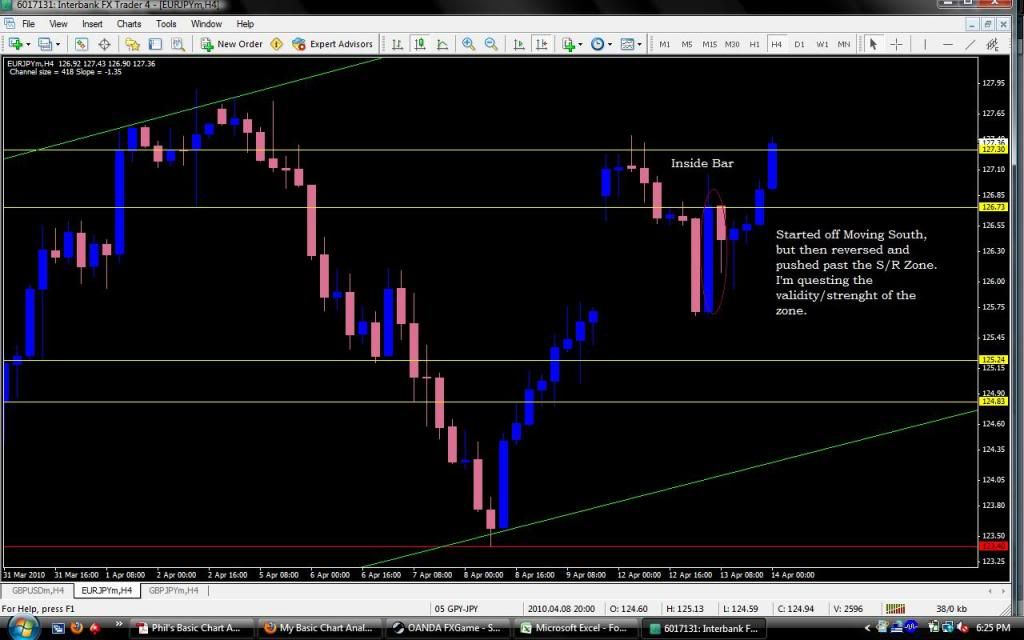
So I executed my first trade earlier today. Unfortuantely it was a loser, but it gives me some perspective. It is a EUR/JPY chart, 4 hour. I’m not so sure about the S/R Zone on this one. Comments Please.
i am also a learner, i will put my comments here based on phil’s ebook
the inside bar met the first condition. but there are other conditions like it has to be near SR, trendlines. i dont see this bar at any of these locations. i think thats why it failed. one more thing the big green candle next to this IB is a big engulfing candle which came after few red candles, this indicates trend reversal , so i would prefer LONG trades for the IB and i would place my entry at high of the IB. also inside bars have the tendency to have first false breakout and then move in other direction successfully. trading IB is tricky. my first preference is for long wick candle at a good location
also i am not comfortable at lower TF, i prefer daily. set ups may be few but they have better chances
Your S+R zones are off a little bit from where I’d have put them, and that was part of the problem, but the real problem is that you forgot what an IB usually signals. They usually form when price is about to change directions… For the 24 hour period before this IB the price was falling, so the IB was actually signaling that the price might reverse and go up, which it did! 
There are other factors that point to this being a bad trade, at least by my placement of the S+R zones. The main one is that the profit is simply not there…
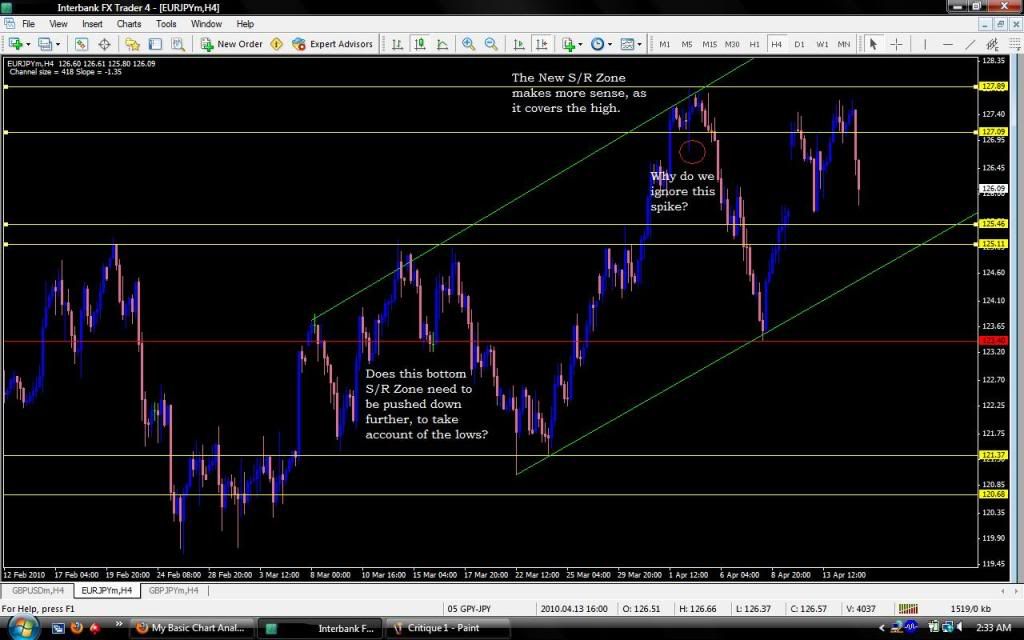
PS: If you don’t see why I placed my S+R zones where I did let me know and I’ll post a pic explaining it.

Thanks Muthu. I’ve got a light load of schoolwork for the next 2 weeks, but after that it’s back to the grind so I’m not back permanently…
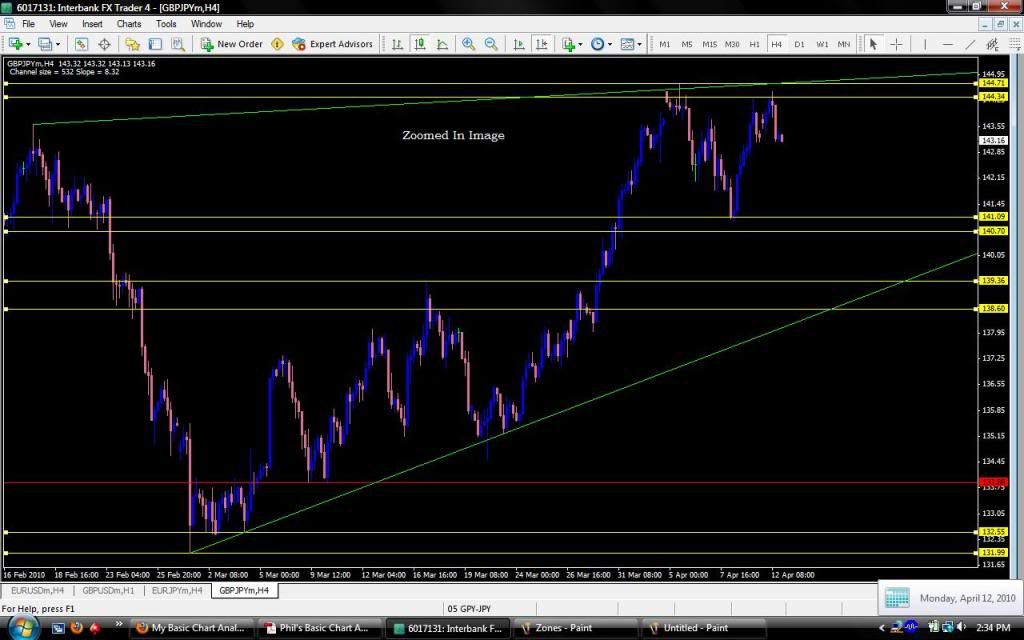
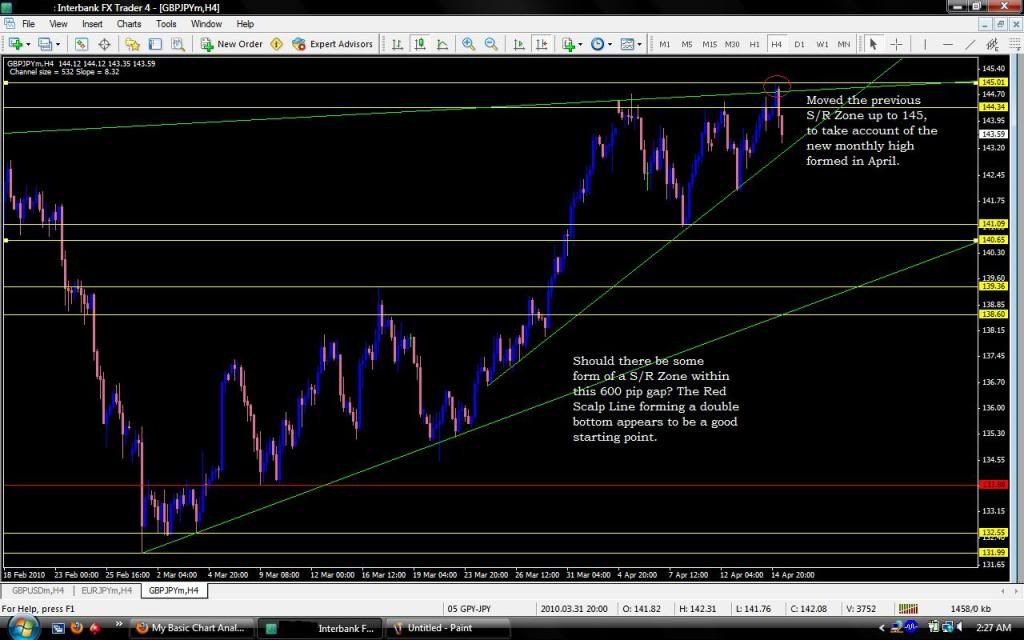
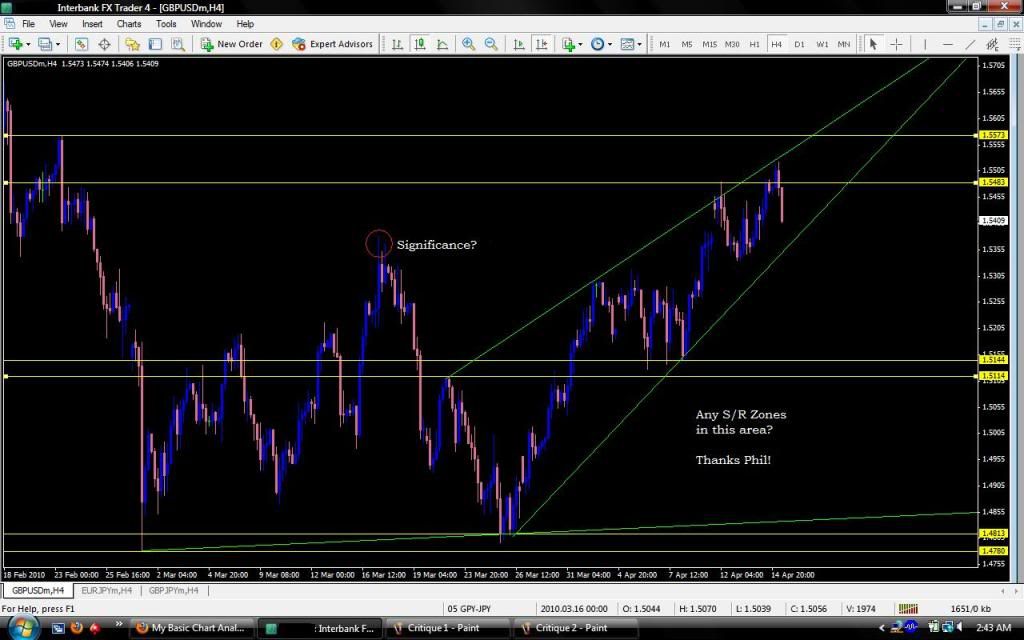
Appreciate the advice Phil. Sorry I’m asking so many questions, I understand that you have to return to school work soon, so I want to get as many questions in as possible. I attached three four hour charts, EURJPY, GBPJPY, and GBPUSD, in that order. These are the three currencies I trade, please comment on the S/R Zones and any other questions embedded in the images.
Thank you Phil, I feel like I’m learning more and more by the day.


Hey phil i didnt see around for awhile , you know what im using this Price Action system its the same what everyone one making profit from but im confused about one thing? Break outs!!!
There is 3 way to trade Break out :
1 - To take a trade when the price break the level and one candle close above the area?"the price could come back and the stop loss will be high probably under the last swing or under the range "
2 - wait until the price break then retest and then wait for candle signal? "the price could never come back to test the broken area "
3- get in direkt when the level is broken “the price could come back and close under”
Another qustion : if the price break the area could i look on smaller time frames to test and count this as tested level? or it should test the level from the same time frame
for example : if the daily chart broken triangle , but its back tested on the 15min chart or the one hour does we count this back testing? or it has to test back from the daily?
watch this chart , the price broke and didnt test , make range area and broke it again without back testing
i dont know what to do what do you think phil?
If you want a simple calculator to figure out lot sizes:
http://forums.babypips.com/free-forex-trading-systems/36214-simpliest-fx-calculator-here.html
Hi all, guess i missed the party! Is the thread still on going?
Anyone trading this system anymore ??
babypips.com education section+phil’s little ebook (and lots of practice) = money! all for free.
lol felt this was worth resurrecting bc it’s like a condensed james16group, but free.
I’m hoping that some people start looking at Phil and NickB’s system again! (similar in style).