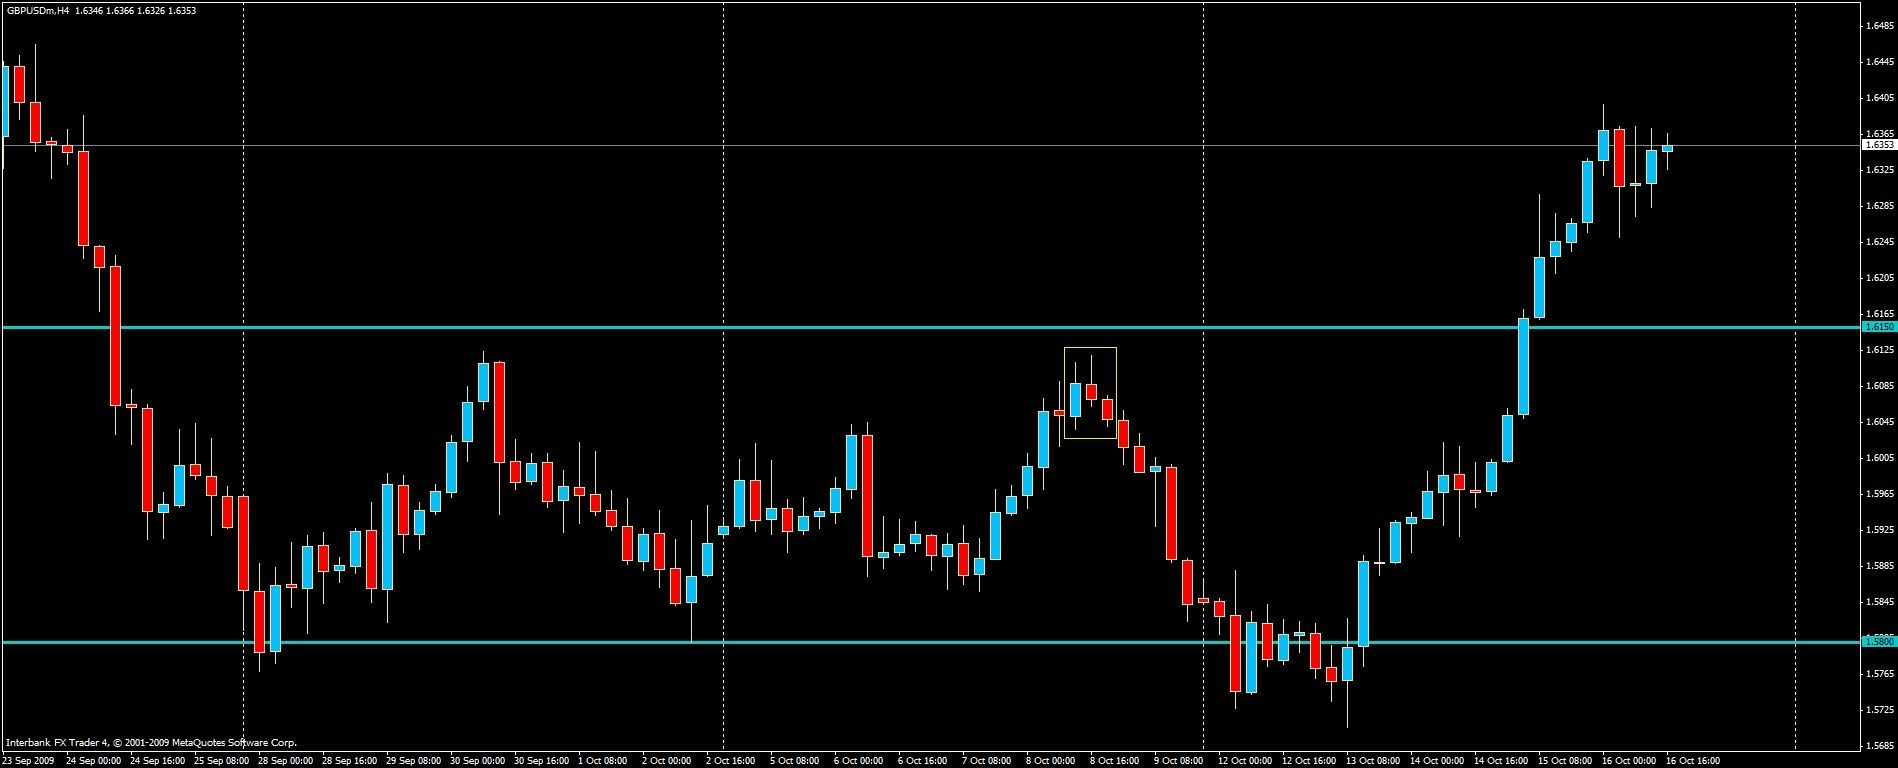
This is a 4H chart of GBPUSD from today. I’ve highlighted the formation that triggered me to take a short position on the pair. I would call it something like a bearish three outside down candle formation. It also looked like the pair was again rejecting the 1.61 level same as it had done at the end of September.
When I got to work I closed myself out at +40 pips like a real professional profit killer…
James Bond and other superhumans could have squeezed something like 300 pips out of it.
Anyway, that’s what my chart looked like and why I got into that trade.
The pinbar I was looking at Thursday changed before the candle closed, so it wasn’t a trade after all.
There was a nice looking doji/pinbar that was also an S+R bounce today, but since it’s the second to last candle of the week I’m skipping it for now. We’ll see what happens Monday, it might still work out to be a possible trade.
I’ve also got 1.4967 as a swing high, but if I was trading this NickB style I’d call that an average line, so I’m skipping it for now. I only want strong lines. If price falls on Monday it might turn into strong line, though.
So to sum up this week with my modified “Project MacGyver” system: 1 trade, 0.5% account gain.
The reward awaits us when we’ve been picky for a while and the setup with a capital S comes along.
How is the work coming along on the EA?
I’d like to have a go at testing the EA if it’s gotten that far. It would be a big help to just tell it what line to watch for closes past, SL size, pos size and total account % loss to quit at and then just let it do it’s thing.
That way I could possibly even catch a setup while at work every now and then.
It should be finished sometime next week. And by finished I mean the testing version, not the finished product.
It works now, but all the variables are hardcoded, meaning it only does 8 attempts, 5 pip stoploss, and 2% total risk. I have to get it set up where all those things can be changed by the user.
EDIT: Actually, make that the week after next. I forgot I’m going to be gone most of next week…
Is the 2% the total risk on each trade entered or the total it would risk over 8 trades?
How about moves to break even?
Doing a loop in there somewhere could enable it to keep going until a 2% loss was hit and then stop.
Just a couple ideas…
I have a question base don this.
Say I place a potential trade using standard methodology at maybe 50pips and I go at £1 per pip risking a maximum £50.
Using the smaller stop mentioned here, the stop loss would be 5 pips, so I could risk a potential £2 per pip at maximum loss of £10 on each trade and a maximum of 5 trades being stopped out to still get a maximum loss of £50.
How do you control what happens if the trade is triggered, returns to the stop and then just hovers up and down around the entry line potentially triggering and stopping out trades repetitively? This seems the most dangerous part and at only 5 trades allowed with maybe a few extra stopped out for breakeven this isn’t a great deal.
Quite true, this is the big drawback of the method. If price should decide to flip back and forth across our line, that will end in a loss, whereas with the “standard” method we might instead get a winner.
So the key to success lies in only… ONLY using this approach when we manage to identify an A+++ setup.
Unfortunately this isn’t the holy grail (blast!). But when used the right way it is a method with extreme potential (I think, until proven wrong).
In all honesty it’s just a different approach to entering the market and it will only work if we can, with good precision, identify those A+++ setups - that is the real challenge as always.
Yeah 2% is the total risk over the 8 trades, so each individual trade is .25% risk. I’ll probably end up raising this to more than 8 though, like MacGyver suggested. My only trade so far took 7 attempts, and that’s too close for comfort.
For breakevens I don’t really have a “rule” yet. I’m just taking each trade as it comes.
On my IBFX chart it isn’t a long wicked candle. So I had a look at the FXCM demo and I see what you mean.
On the weekly chart it’s difficult to find any real trend, the pair pretty much started ranging back in early May. On daily if I had to pick a direction I’d say that the pair has been in a down trend since around Aug 10. That downtrendline was broken through with force on Thursday of the past week.
Two reasons why I’ll pass on this setup:
The pinbar is small and more like a doji than a shooting star - we only want the A+ setups
We may have just witnessed a breakout going against the pinbar - is the downtrend really still intact?
After flipping through the charts only two pairs that are interesting to me right now are EURGBP and GBPCHF.
I decided to short EURGBP directly when I saw that it gapped at the opening. I’m having a bit of trouble with MT4 right now so I’ll be taking the trade only on Oanda.
Be aware that it’s countertrend and there’s the 0.90 PPZ to watch out for. The trade needs to be managed with special reference to moving to BE.
I’m still in a learning phase, one I expect will last until the day I die…
Anyway, I’ve felt more comfortable trading reversals than breakouts, but today I’m sitting here looking at two pretty nice breakouts on the daily charts and I’m thinking I’ll get my toes wet at least.
To get some warm and nice feeling inside I’ve also found a pretty nice trade on the AUDNZD where todays bearish candle seems to suggest a resumption of the downtrend. It also bounced nicely on the 1.24 PPZ.
The breakouts are two Yen pairs, CHFJPY and NZDJPY.
CHFJPY broke above the downtrendline, retested it and now would seem tradable for a long position.
NZDJPY broke through the major 67.0 PPZ, retested it and a long position seems about right.
I’ll risk 0.25% each on the yen pairs and 1% on the AUDNZD. Breakouts are new to me. I’ll place stop orders 5-10 pips beyond todays high/low.
The EURGBP trade is behaving so far and I’m reminding myself that it’s a weekly trade and no tampering unless there’s good reason! (such as a reversal at 0.90).
That trade wasn’t triggered so I saved myself a hefty spread also.
The NZDJPY trade was the only one that triggered.
I’m keeping the pending orders on CHFJPY and AUDNZD for now as I’m still ok with my analysis. I see no reason to close out the EURGBP or NZDJPY trades either.
Will have a quick look at the charts later to see if there’s anything else interesting.
I didn’t see anything that made my hair stand on end on the charts.
EURNZD may be forming a bounce off of the 2.0 level. I’m not going to take it though unless it would happen to time itself for when I can check the charts tomorrow. I need a better signal than what’s there right now.
USDCAD may be forming something to go long on, but it would be counter trend which is a caveat for me, plus the setup is just a potential, nothing finished.