My Trading Log

I will absolutely. I would do it now but I want to be reasonably sure that it holds merit before drawing anyone (read: you) down with me.

If you do want to test it now that you have free time I’ll send it over but with the [B]caveat [/B]that I have [B]nothing [/B]yet to back it but a good feeling.

Don’t make me blush:o, especially as I’m not so sure I deserve it…

hehe…ok I’m teased a bit. I’m actually interested in hearing this…a big claim, but you seem like a sensible guy. Must be a 20 pip stop loss and a 300 pip tp, I dunno.

I’ve had a closer look at it tonight and I’m sad to say it doesn’t work on a day with price action like today.

When it takes too long before you get a big move the small losses add up. That’s not the problem though, the problem is when I attempt to trade it in either direction. That’s much much more difficult than trading it in just one direction.

However, I’ve learned something important. LITS works better when you take entries one way only. That means I’m shelving the idea I had (it does work some or even most days, but I’m going to stay with KISS which means only one way setups.)

The idea was very simple, place a vertical line to mark London open, then place your Line In The Sand at the opening price of the first minute of London and trade every break with a close until price decides where it wants to go. Then you’d just tag along for hopefully enough pips to cover the small losses and then some.

It works like a charm on almost all days where price doesn’t insist on hogging around the LITS line all day without going anywhere really. The dream is your two bar reversal, where yesterday was, say a bearish day and today opens and immediately goes bullish without looking back. Such a day can make you rich fast, especially if you’re able to stay with the trade and let it run for more days.

However, a small range day like today will slowly bleed you out. The trickiest part is managing the trade direction switches without being stopped out and finding yourself having to reopen a same direction position.
And even if you watch 30s-1min charts price can jump many pips in one bar which makes it necessary to use a tight SL.
It’s much easier when you just enter in one direction instead of reversing the direction every time.

Sorry to get you excited about nothing… I did learn something though - that I’m now just looking at options for playing it in a one way street. Which means that I’m pretty much back to A+ J16 setups - they’re the best reversal setups I’ve found.

Trying for a best fit with life in general and charts and time frames, I’m finding it nice that the upcoming MT5 offers more time frames, such as 2H, 3H, 6H, 8H and 12H.

Because LITS is dependent on a very tight spread, I’m only looking to trade it on the following pairs on Oanda:
AUDUSD
EURJPY
EURUSD
GBPUSD
USDJPY

This is the reason I’ve not been trading that much lately, I’m completely hung up mentally on LITS. I understand it’s potential and therefore it’s hard to focus on playing the usual J16 trades for sometimes less than 1:1 R:R. I really think this is my way forward. Then again, I recall saying something like that at the beginning of this thread when I was all over Alexander Elder’s methods…:rolleyes: I’ve learned a bit since then though.:wink:

I know many are complaining about MT5 with regards to FIFO and so on. Me, I can’t wait! I hope FXPro (use them for charting only) will offer it soon.

Wouldn’t it be sweet if USDJPY closed the week above 88? Mmmm.

No, not a grail - but maybe a nice cup to drink from. :smiley:

I would take a trade evry time a bar crosses the line and closes like that. I’ve looked at adding a “buffer” zone, but that really doesn’t do anything except introduce a “no trade zone”.

If we add a buffer like that it basically becomes a box breakout.

The one way setups are a whole different story. It makes me want to stay at home and just watch for A+ setups all day. That’s the way I’m going and in the mean time I’ll continue on with ordinary J16 trades and the J16 thread project.

Since you have some free time, watch for a A+ setup on the 4H on a low spread pair and demo trade it like this (Oanda’s really great since you can preset lot size and SL): SL = spread + 1-2 pips. Place a line a few pips beyond the high/low like with any other J16 setup. Make sure that 1 pip equals 0.05-0.2% of your [B]demo[/B] account.
Every time price closes beyond the line you immediately enter. If price hits your SL but then closes beyond the line you reenter. If SL gets hit you just wait for it to cross and close again.
If the setup works out and we both know the win rate on J16 A+ setups, sooner or later you’ll be along when price takes off and starts running. Then the sky is the limit.

I have some further thoughts, but that’s the basics of it. Nothing fancy at all and nothing new since before really. If you get a chance to forward test it on demo that would be great.

If you just get 50 pips with 0.1% per pip that’s 5% minus the failed entries. Imagine 200-300 pips every now and then… Even if price stops you out 15 times before heading off, that’s just 15 x 0.2 = 3% or with 3 pip SL 15 x 0.3 = 4.5%
In both cases we see that we end up positive even if we get stopped out 15 times and then just get 50 pips. When I’ve looked at how setups would have played out, price usually takes off long before it hits the SL 15 times and it will tend to run for more than 50 pips.

I think this is not only a very viable way to trade J16 setups, I think it’s [I]the[/I] way.

Keys are low spread and A+ setups, the rest is just about clicking a button really. Like the guy in the hatch did in Lost. :smiley:

I can’t find any flaw in this method but two brains work better than one huh?

I’m going to put up a few charts tomorrow to show graphically exactly what I’ve been trying to explain in words.

I’ve experimented with 10s, 30s and 1min. I seem to like 30s, but Oanda has virtually no history so all chart scrolling has been done on MT4 1min. It actually seems to work pretty well even on 1min, but I’d go for 30s and then adjust when experience suggests so.

Tick charts I have no idea to be honest but I sure would like to have them!

First of all, sorry about the huge chart but I really want it to be possible to scrutinize it closely. I hate charts where you can’t quite make out the text you want to read etc.

All right. I’ve saved this chart using MT5. That’s why the currency pair and time frame doesn’t show in the upper left corner like it would normally.

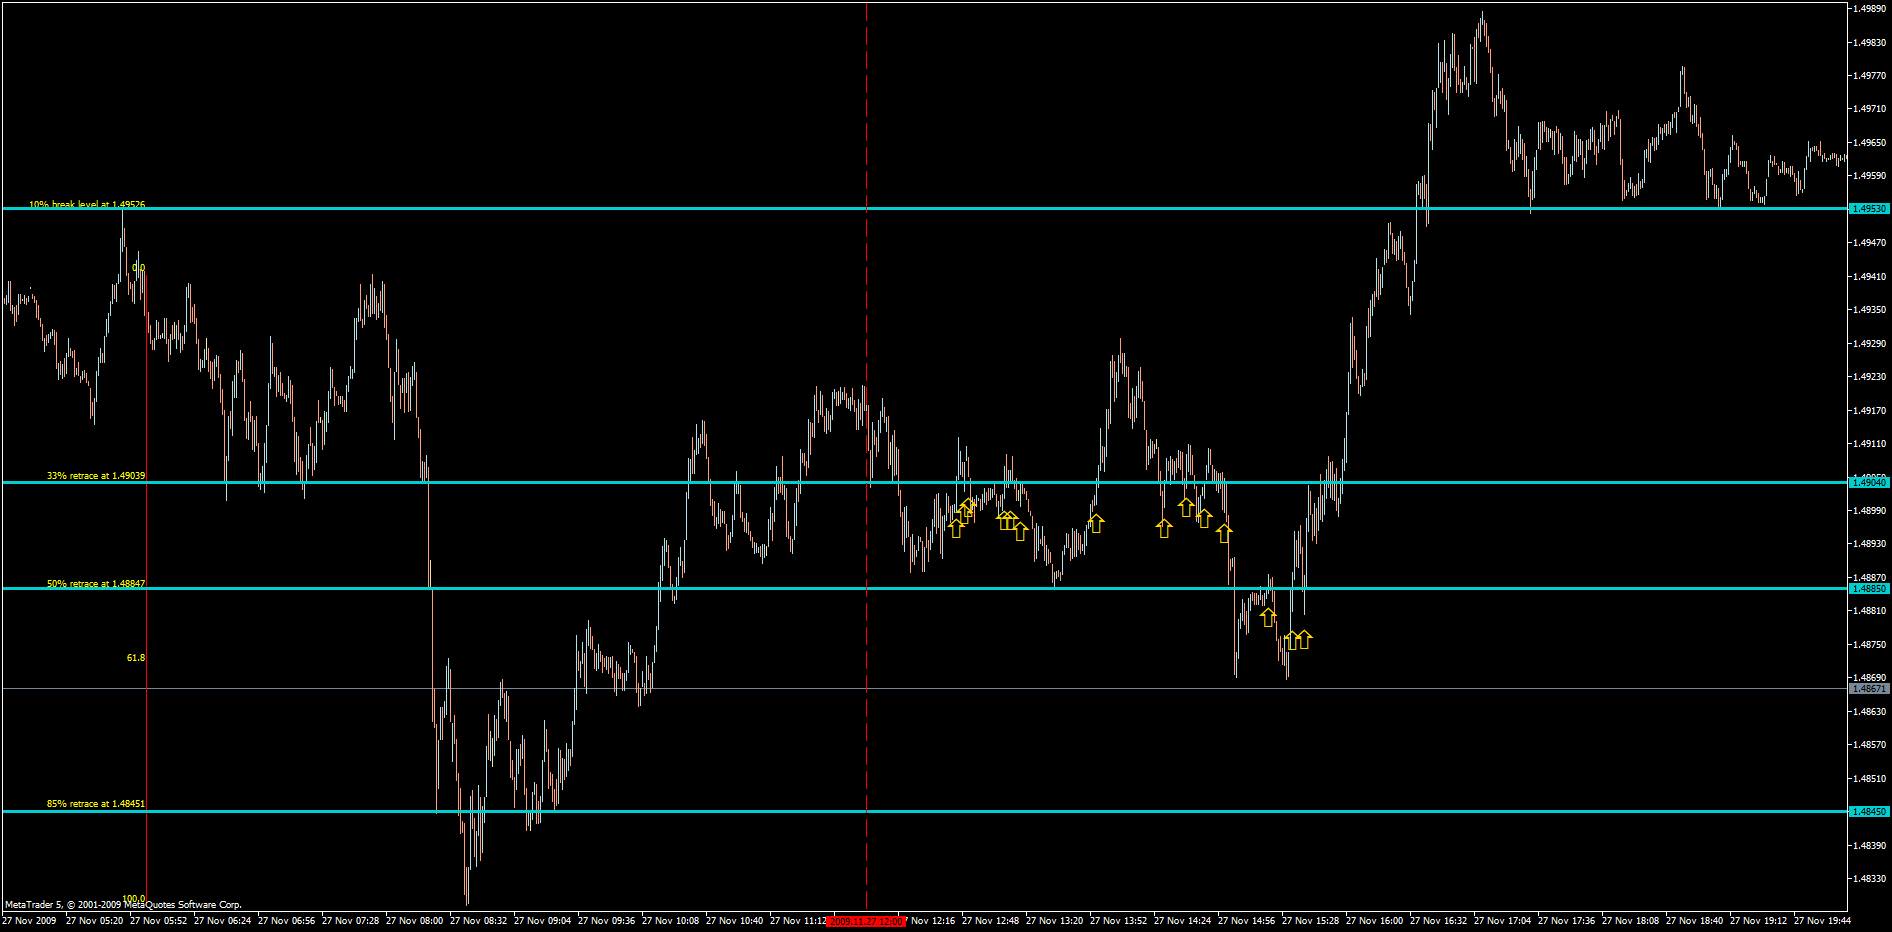
This is a 6H chart of EURUSD. I’ve tweaked the fib tool with the help of the tip I posted a while back. I’ve marked the 10% extension above the pin bar as a break level and also the 33%, 50% and 85% retrace levels of the pin bar.

It’s a 6H pin bar reversing back into the trend direction and rejecting the 1.4850 short/medium term PPZ. Good quality pin bar shape in my opinion.

Now what?

OK, we know for a fact that almost all pin bars do break, this is true also for those pin bars that later fail. Therefor I’m not waiting for the pin bar to be confirmed by a break. I put my faith in the high probability setup I’ve identified and go to work immediately.

I’m looking to try to enter at any of these LITS levels: 10% break level, 33% retrace and 50% retrace.
(Another possibility is to change the 10% extension simply for the close of the pin bar.)

If the pair starts by breaking the 10% extension and then moves down to hit the 33% retrace, that means that I start trading the LITS entry strategy here instead and if it moves further down to the 50% retrace then I’ll trade LITS there instead.
If the pair for instance doesn’t break but moves directly down to the 33% retrace, no difference - I apply LITS entry method same as above.

If I manage to enter at the 50% retrace I do not try to add when price again reaches the 33% retrace or the 10% extension, although pyramiding like that may be a future thing to study.

Stop Loss used in this example will be 3pips including spread, which on Oanda roughly means 0.9 pip spread + 2.1 pips leeway. Every pip will be worth 0.1% That makes our risk, R, 0.3% per entry attempt.

Can you see what will happen? The end result will be an entry at the 50% retrace and at the close of the first 6H bar of the current week we’re up by roughly 190 pips.

That’s 190 x 0.1% = 19%
Our account growth can be expressed as:
19% - number_of_failed_entries x 0.3%

At no one time has our risk been greater than 0.3% (losses do add up continually however).
And do notice that the super cool trader that managed to hold on to the trade had the chance to get all the way to 250 pips profit at the second bar from the right, maybe he’s still holding it for even higher prices to come…

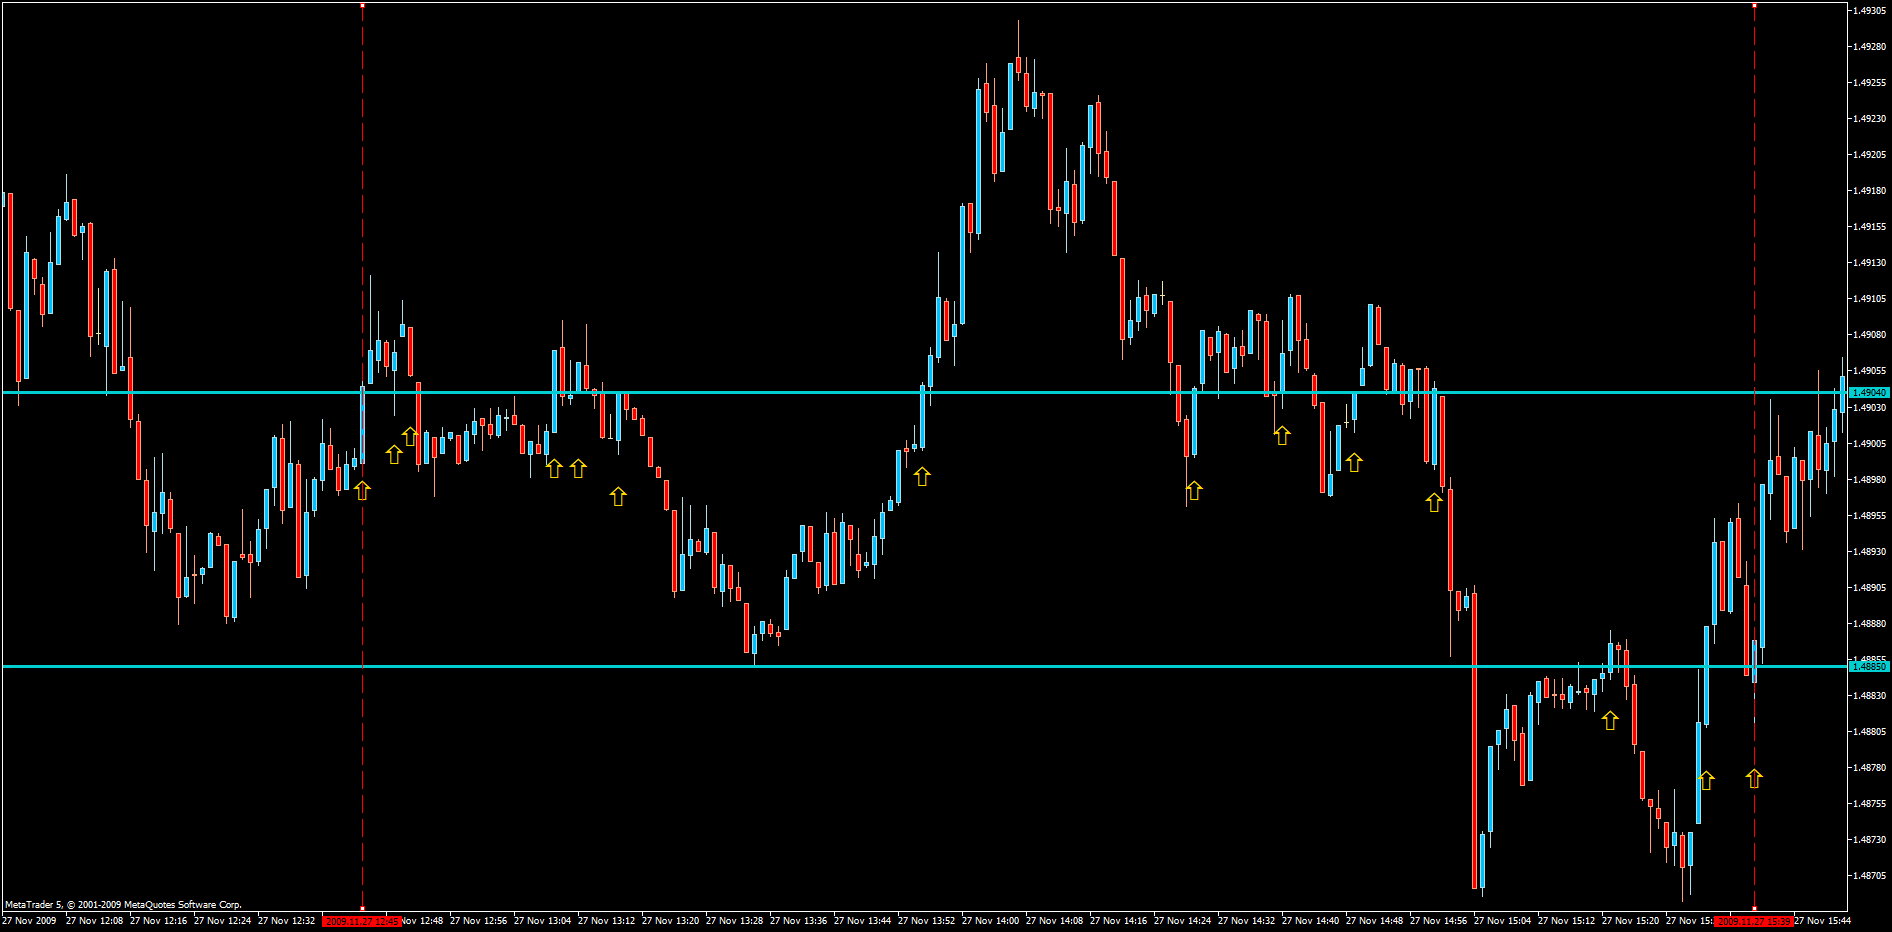
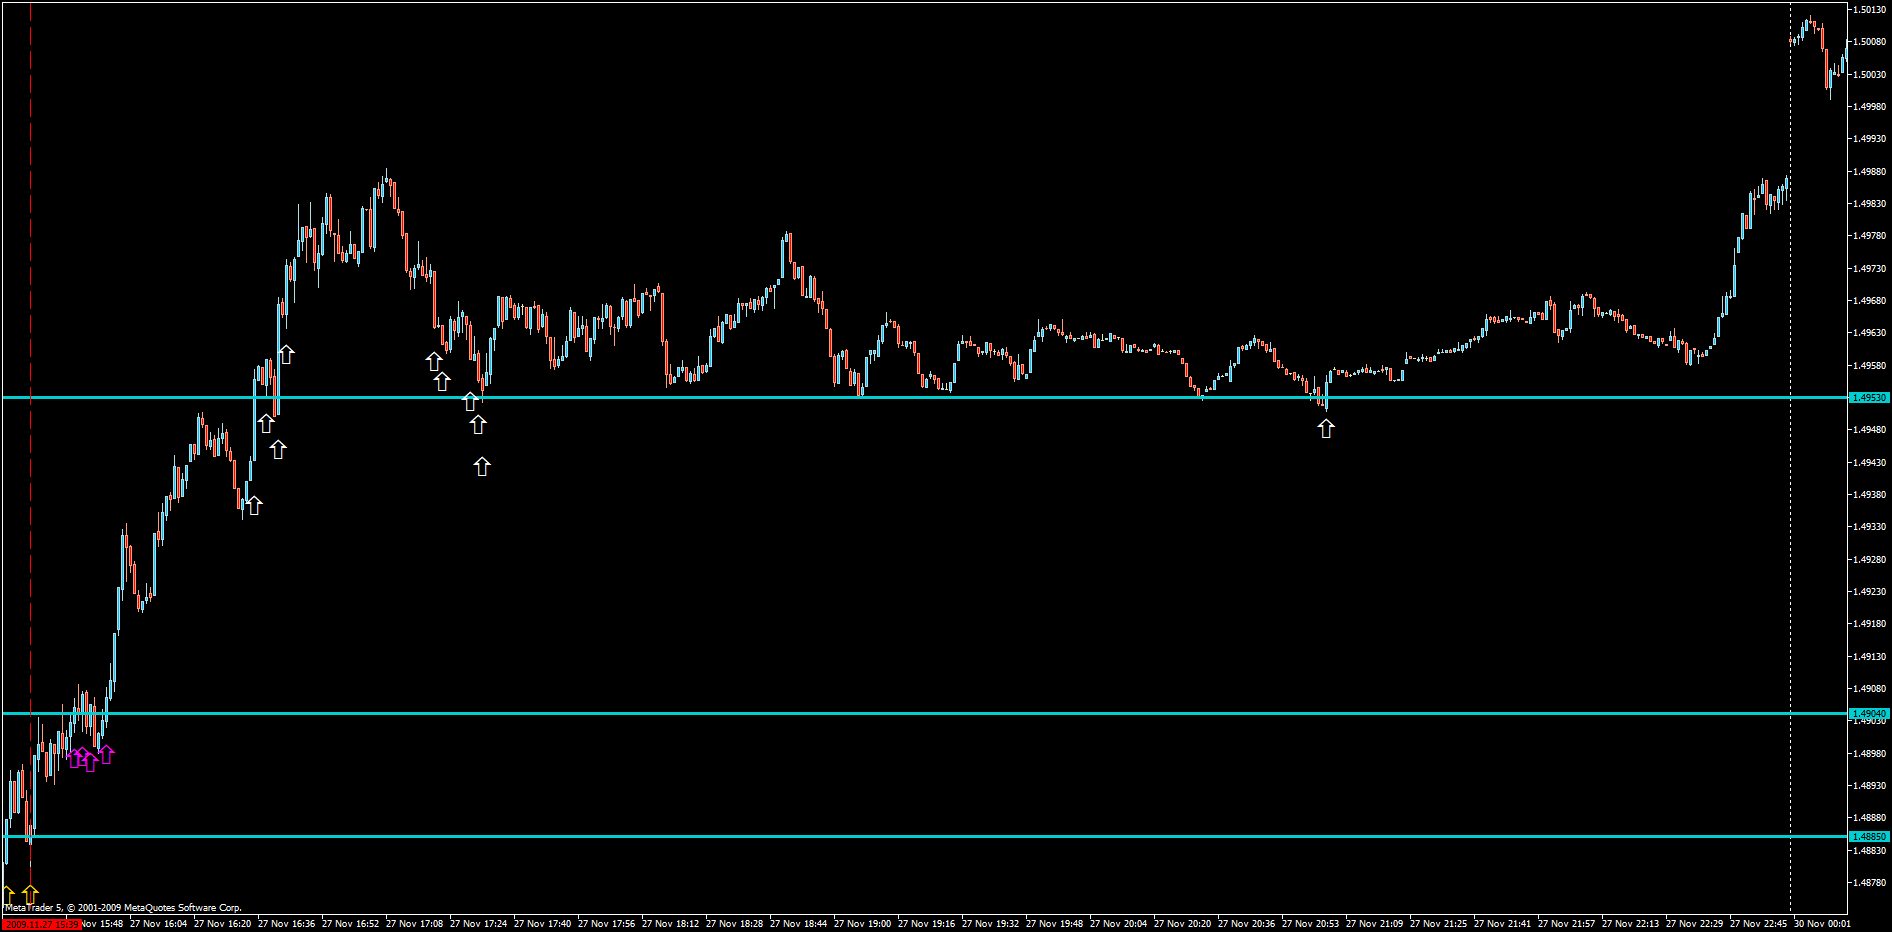
Next post will display 1min charts showing how many number_of_failed_entries we have during price’s path through the different levels before the trade starts running.

What we do know is this: 19/0.3 = 63.3
We have room for a couple of losers… (However, we want a reasonable drawdown right?, so 63 losers wouldn’t be that attractive to put it very modestly)

Next post may have to wait until tomorrow.

Correct.

I’ll post about this part later.
In short, to reduce total risk we need to adjust the % per pip. I’m also prepared to risk more than 2% on these setups. More tonight or during the weekend.

This has been a very busy weekend so I might not be able to produce the promised post on [I]number_of_failed_entries [/I]and risk management tonight.

If there’s any time at all I’ll probably have a look at the charts.

Well, couldn’t help myself so I counted:

[I]number_of_failed_entries [/I]equals 14 for the example posted earlier. I’ve saved chart images and I’ll post them up tomorrow along with an alternative version where you just enter on the close, 20, 40, 60 and 80% retrace levels.

Just for the hell of it I might add another post showing what happens if we keep entering at every level as price has reached it’s bottom and starts climbing. That made me feel a bit tingly I’ll admit.

Anyway, 14 x 0.3% = 4.2% Risk

Saying that was our risk is a bit false however, as we know that only after the fact. I’ll get back to the promised charts and discussion on risk management tomorrow.

Nighty night BP

edit: mind these calculations are all made on 1min charts, 30s might improve or worsen these numbers slightly but hardly enough to be of any real significance.

In this post you’ll find 1min charts going from min zoom to max zoom, showing with arrows the locations where a LITS entry would’ve been made in the recent example setup.

I want to point out that I did not look at lower time frames when picking this example, the only thing I cherry picked was the 6H setup.

chart view 1:

chart view 2:

chart view 3:

chart view 4:

The last arrow represents our successful entry which then carries us up up and away. This is the entry we are patiently waiting for every time we pull the trigger. It represents a 3 pip SL in this example and when we take profit around +200 pips we will have made a nice account increase whatever $ value we decide to assign to each pip.

What this means is that everyone can decide for themselves two things that control the total risk of the LITS entry technique when used to maximize gains from a setup like this one:

  1. Lowering the $/pip value reduces risk per entry but also has an effect on the profit. Somewhere around 0.01-0.1 $/pip would seem reasonable.
  2. Decide a hard SL that, when reached, means no more entry attempts for that setup. This SL can be anywhere from 1% to the popular 2% or even higher.

1 and 2 together define the total risk and the maximum entry attempts before calling it quits on the setup.

One thing we should bear in mind is that this technique requires the ability to adjust the $/pip perfectly, which is often not possible with brokers that do not allow micro or nano lots. I use Oanda and they’re great with regards to this fundamental issue.

As mentioned, here’s something to tease the greed center.

This is what the entries look like if we don’t settle for just entering at the 50%, but also enter at the 33% and the 10% break levels. In other words, we’ll have 3 LITS positions running when the trade reaches our TP.

Here’s the chart. Entries at the 33% retrace are magenta, at the 10% break are white:

We have 4 entries at the 33% and 10 at the 10% break.

That’s a total of 14 + 4 + 10 = 28 entries instead of 14.

The average entry of those 3 positions would be 1.4914 and the average TP would be 170 pips instead of 200.
That gives us 0.1 %/pip x 3 positions x 170 pips = Profit 51%

51% - 28 x 0.3 = 42,6% account increase.

If the setup had failed, this aggressive technique wouldn’t have been that fun huh, but I wanted to tease and show it’s potential. We could have had a 42,6% profit on this one setup.

If anyone is interested, try this same thing but change the levels from 10% break, 33% and 50% retrace to; close, 20%, 40%, 60% and 80% retraces.

None of the above is in any way fantasy, all it takes is the ability to identify an A+ setup on 4H or higher and the time available to trade it LITS style.

If we learn nothing else we should at least be able to take away the importance of discipline and money and risk management from this example.

All right, that will have to do. No more LITS ranting for a long time now. I feel I have explained it pretty thoroughly, should there be any questions I’ll try to answer them of course.

Now the plan is to get back to the J16 thread and have a look at the charts every now and then.

Yes, enter on the close.
Actually, the wick is only around 1.6 pips so the 2.1 SL is safe.

Hi Guys I am new to this Forum, I just wanted to say hello

There’s never enough time in life. That’s an objective truth!

What we want is to reduce the number of entries and/or increase the profit as much as possible.
I’m looking at using small PPZs as one method, and another option is to just use one level to enter, such as the close, 10% break or a 33% retrace level.

Another route is to use more levels such as every 10, 15 or 20% retrace to get the best entry.

I’m currently pretty fond of the 0, 20, 40, 60, 80% version with or without adding entries at each level.

Well, here’s one opportunity for LITS I wish I hadn’t missed!

A few of these per year is all we need:

I will, it’s just tricky with such short notice. Patients would not be happy… There’s no helping it though, I will take days off. I’ll probably start trading seriously again around the end of March. I want to finish the J16 project and tweak my methods a bit more first.

Yeah and the nose of the pin wasn’t overly impressive, so good choice sitting on hands.

edit: Looking at the weekly also kind of gives a hint that further declines are ahead before trend resumption.