Not really. I haven’t looked into its use, but when I fiddled with it, it does this arc thing when I’m setting the points, but once I set the points, they all become vertical lines.
Extensions are/should be above or below 0 not 100. An extension occurs when the market retrace to a percentage of a particular swing, then bounce/reverse creating a new high or low, this high/low is called the extension.

The retrace levels should be counting upwards, 0, 382, 50, 618, 100. You would then sell on rallies to whichever number you believe will be the end of the retrace. The extension would now be anywhere below 0.

hmmm i guess i was not using it in the prescribed way then, during a downtrend I was using the fib retracement tool on the small upswings to give me exit points when the PA resumed the downtrend. (assuming it would resume the downtrend)
I pulled the fib from the bottom of the last low to the top of the current upswing, as the upswing goes higher i reposition the fib to keep pace with it, I continue to do this until i get my entry point, in the case of the picture I used the rebound off the 200MA and the subsequent down turn in the price action.
( I wouldnt do this anymore though, I believe I just got lucky that time, i realise the price doesnt usually rebound off the 200MA like that all the time)
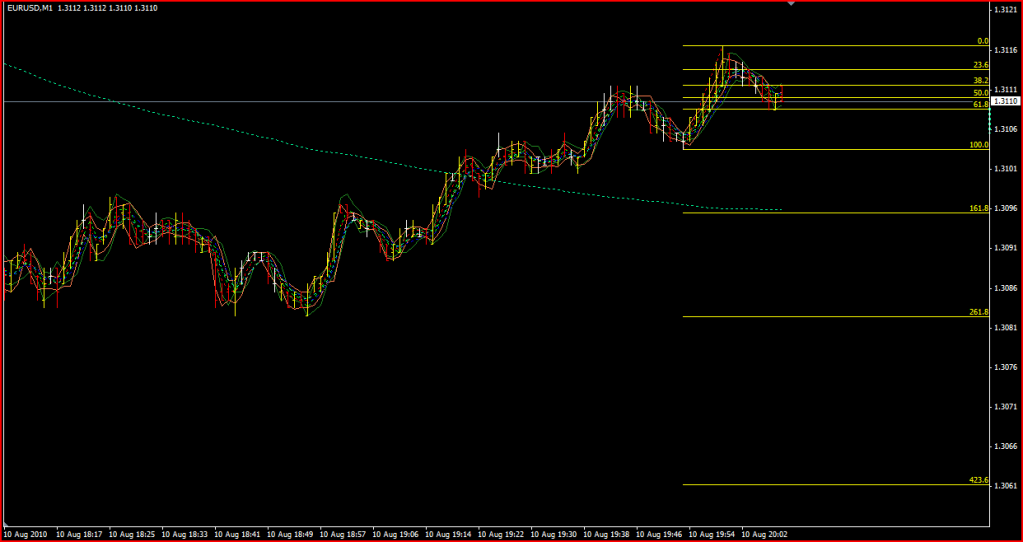
So anyway, when this happens I have my fib pulled from the low to the high.
The result of this is the fib levels extend downwards, the 100% level is equal to the previos low and the further levels extend downwards below that previous low all the way down.
I pulled one on the chart image below to illustrate what I mean.
I would then use the fib levels as potential exit point, that was the basis of my trade that day I was experimenting with ways to identify exit points I didnt take it any further though so I have yet to find out how well that would do as a regular exit point indicator. I was considering pulling the fib the opposite way and useing the upper extensions as SL.
For this trade lets use SL as the upper 161.8 and the take profit as the lower 161.8.
Price bars look like christmas tree lights because thats one of my experimental indicators unrelated to the fibs lol
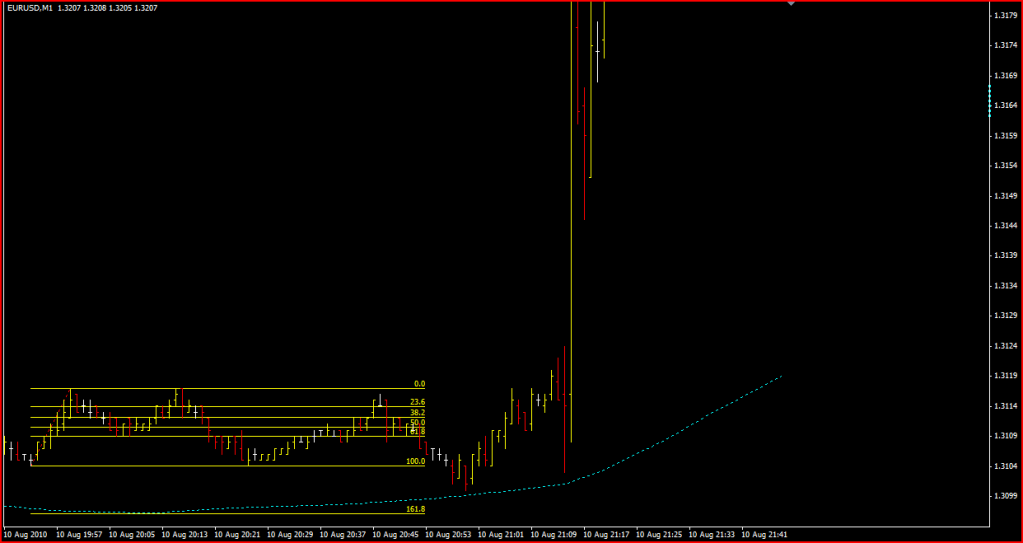
Well that was interesting, when I made that last image I saw the 200MA was starting to bottom out and I thought to myself I wouldnt really take this trade for that reason, but anyway, this is the result.
The PA did continue down past the 100% fib but it didnt make the 161.8 fib. That was predictable though because even though the 200 MA had been showing a downtrend, the previous few downswings were barely making it past the 100% fib, and the 200 MA was bottoming out and showing signs of an upturn, which it continued to do, and the price action did so too in spectacular fashion, for 1 minute chart standards it was a huge 75 pip price spike followed by a continued up move.
The conclusion from that experiment would have to be, the previous few downswings are more important than the 200 MA in deciding which fib to use as the TP level, in this case all the indications were pointing to using a low one, the 61.8 or at most the 100% there was no reason to believe the 161.8 was likely to be breached.
I think I’ll continue on with this and see what else happens, using fibs for exits on 1 minute charts is probably not something many people would do so it makes for a neat little experiment.
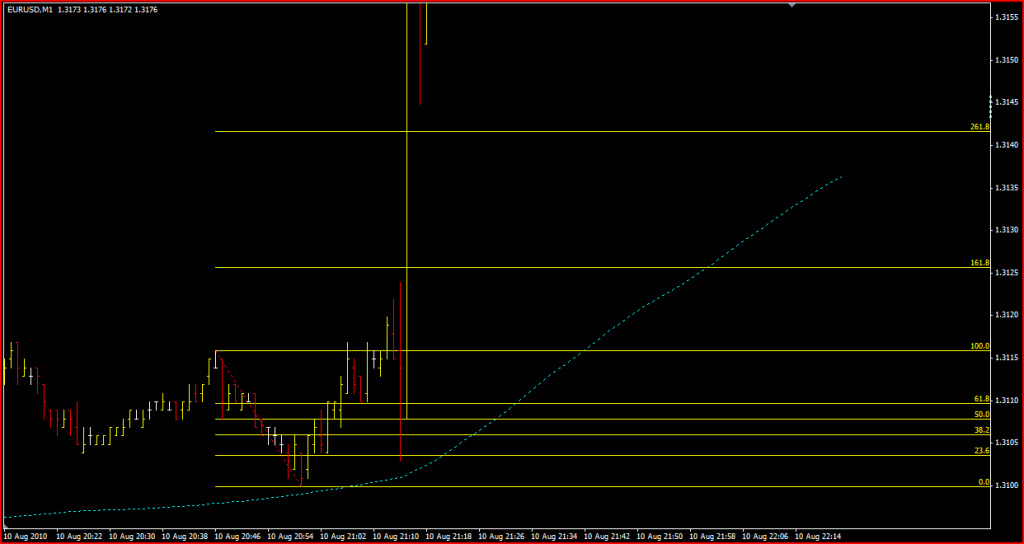
The other thing worth noting is, if I had been paying attention and continued trading the same method, the next trade would have been made by pulling the fib over the subsequent downswing from top to bottom, giving fib extensions upwards as the 200 MA had turned up so the trade would have been long after the price turned upwards, this trade would have got the whole of that 75 pip spike as it happened inside of 1 minute … too fast to have closed it out on the 161.8 fib as it blew right through that level in a matter of seconds.
That would have been a lucky trade but still, as far as I’m concerned, I’d take any trade that makes 75 pips in 1 minute, lucky or not lol.
This is how the fibs would have looked on that trade.
Fibs on a one minute chart?
I don’t find them meaningful unless they are at the very least on a one hour, or up.
Not to say I don’t trade a one minute t/f, I absolutely do. But fibs have been pointless to draw on anything under that hour mark. And even then, I have the chart squeezed down to show the last few months.
The daily chart seems to be the most effective.