This isn’t my trade system. I trade naked chart. I was giving you an example.
That’s because your are trying to use D1, H4, H1, 30M, and all other TF as your Anchor chart.
I feel so stupid right now 
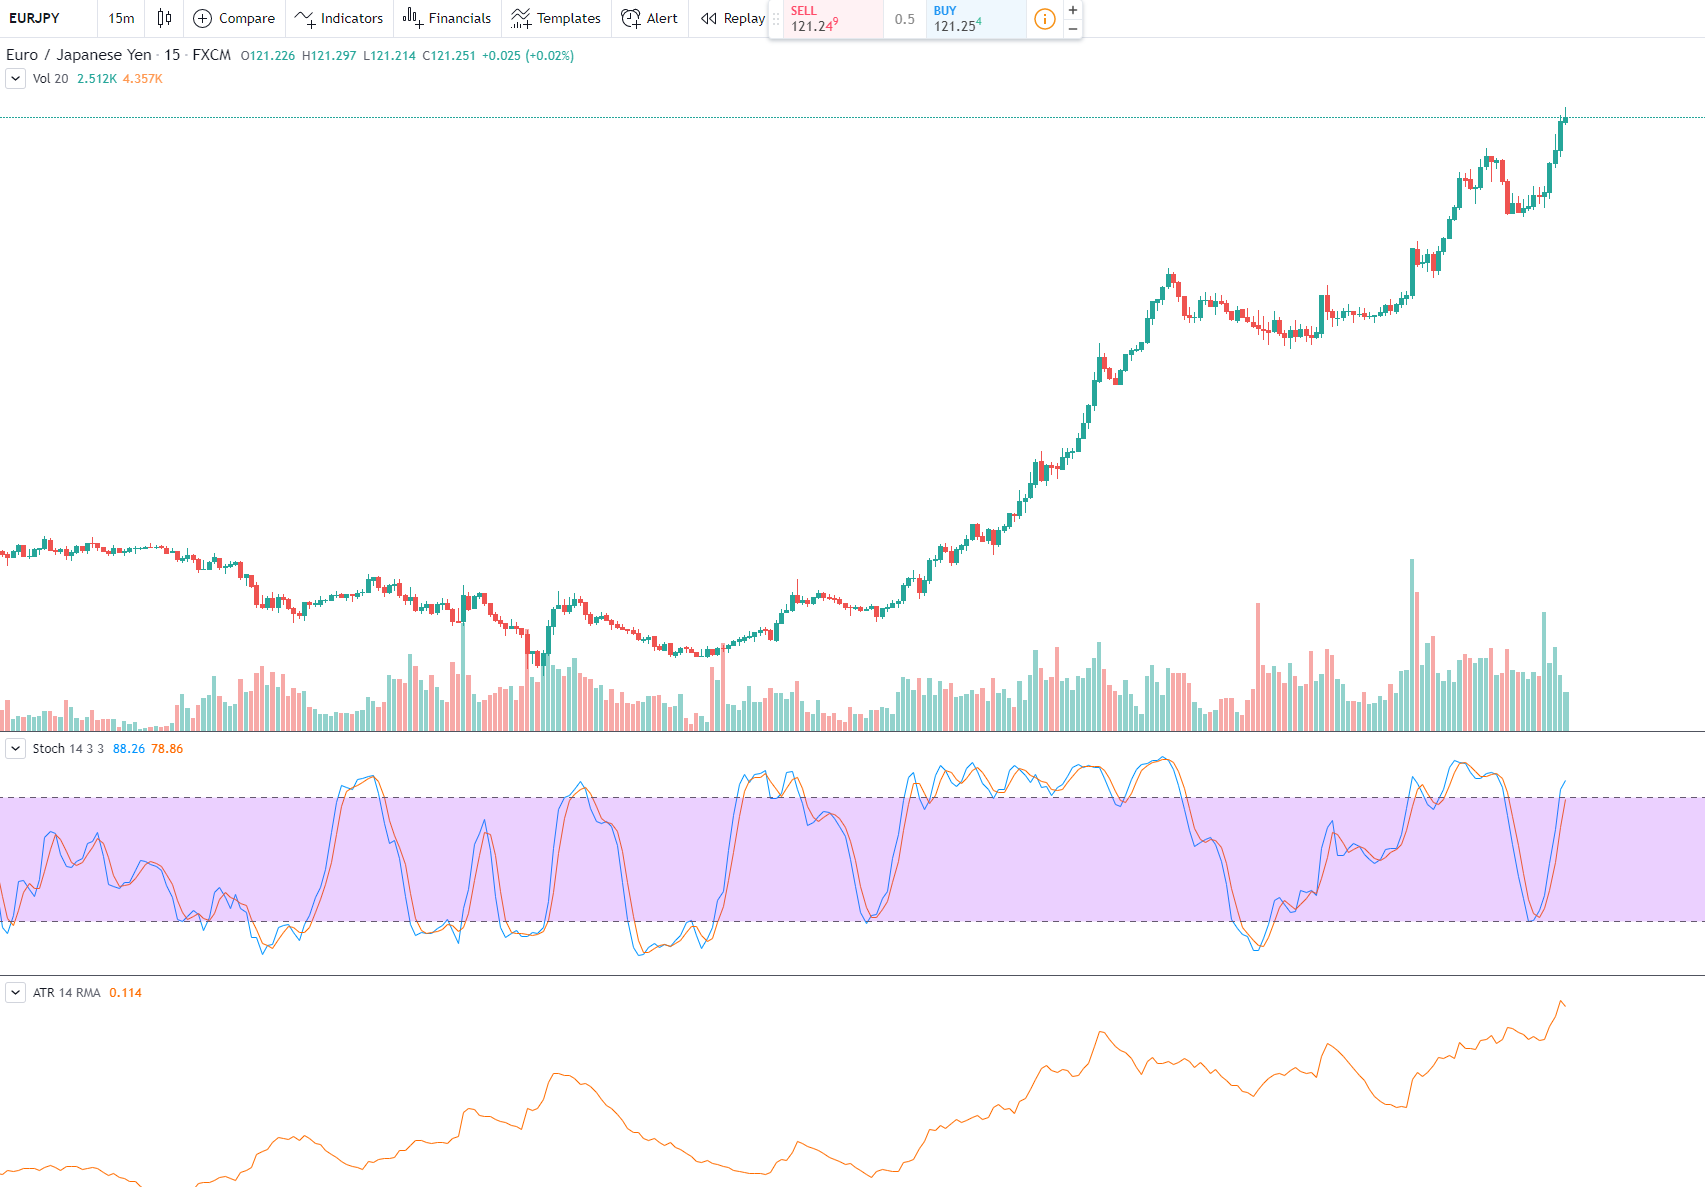
EUR/JPY approaching overbought on 15M https://i.gyazo.com/03489251b595c36337a7c7f4b9a04d68.png
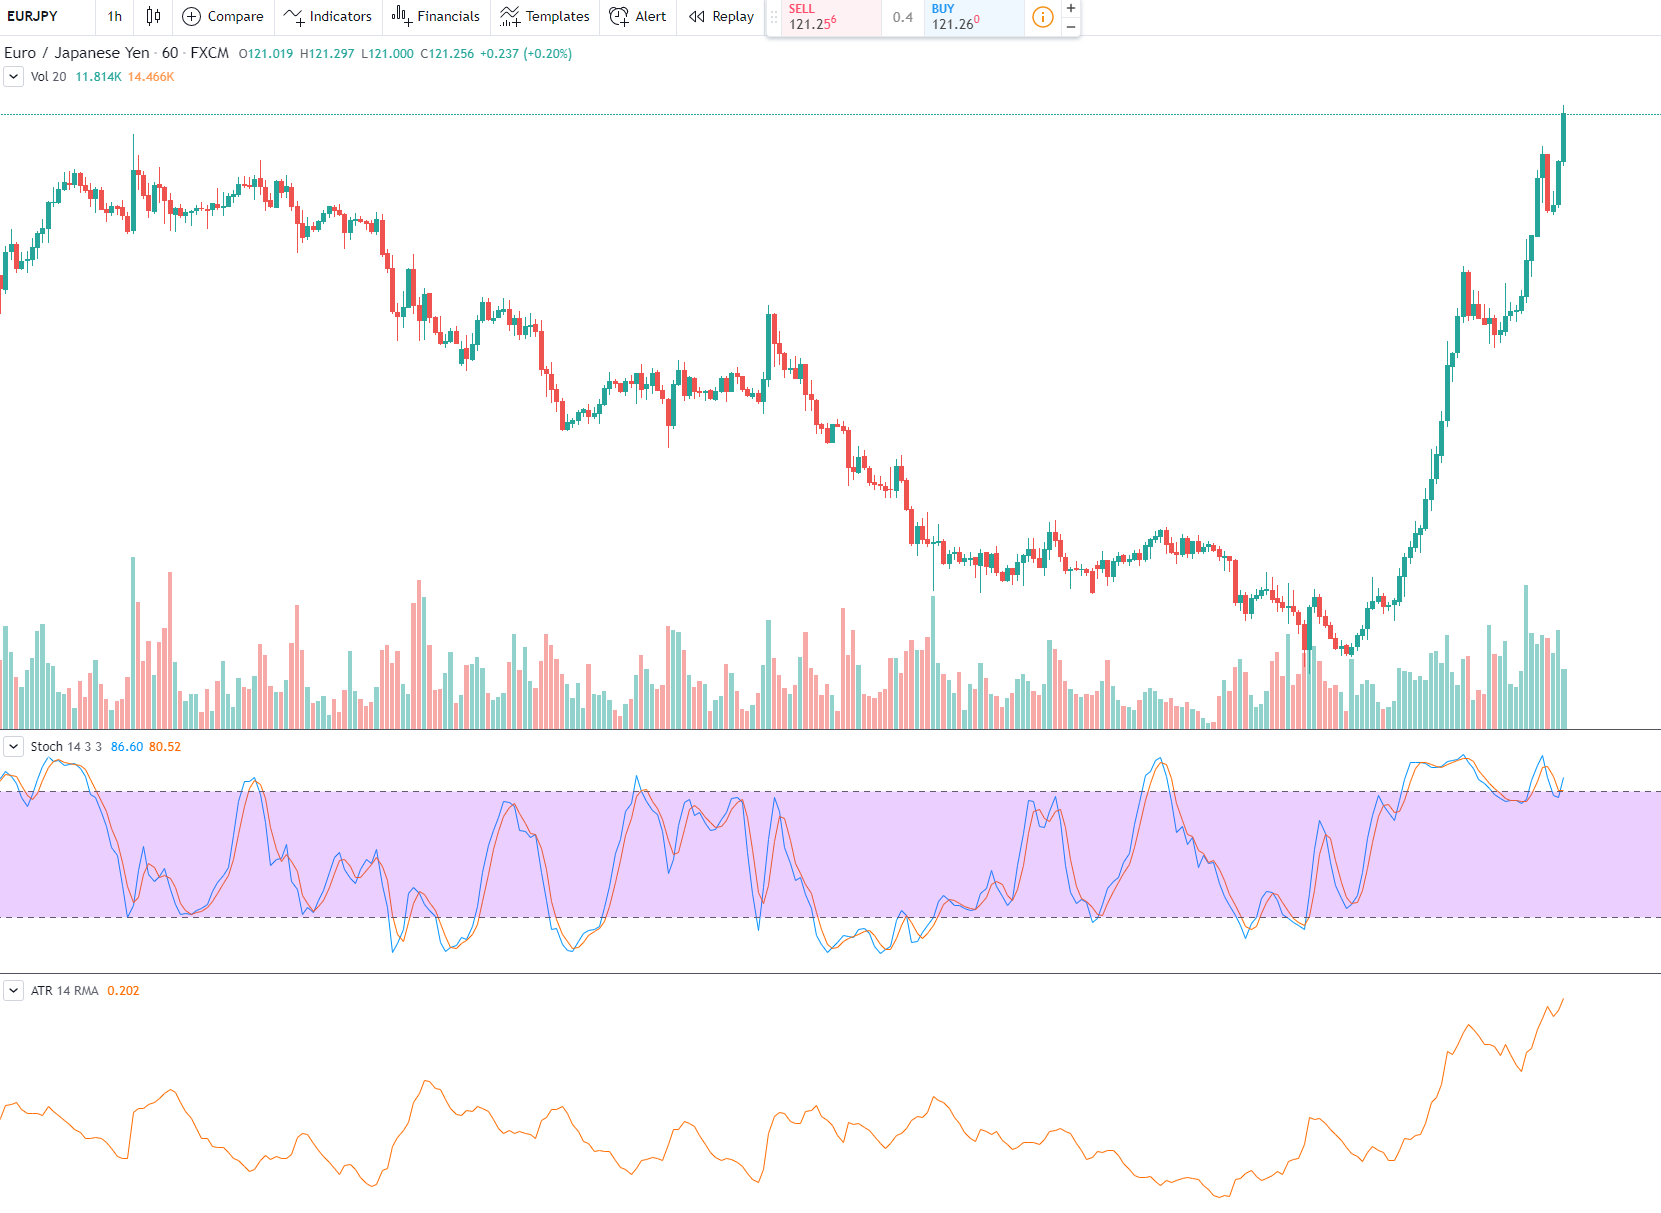
EUR/JPY overbought on 1H https://i.gyazo.com/632d44040c7d61798b899d2973cf17d0.png
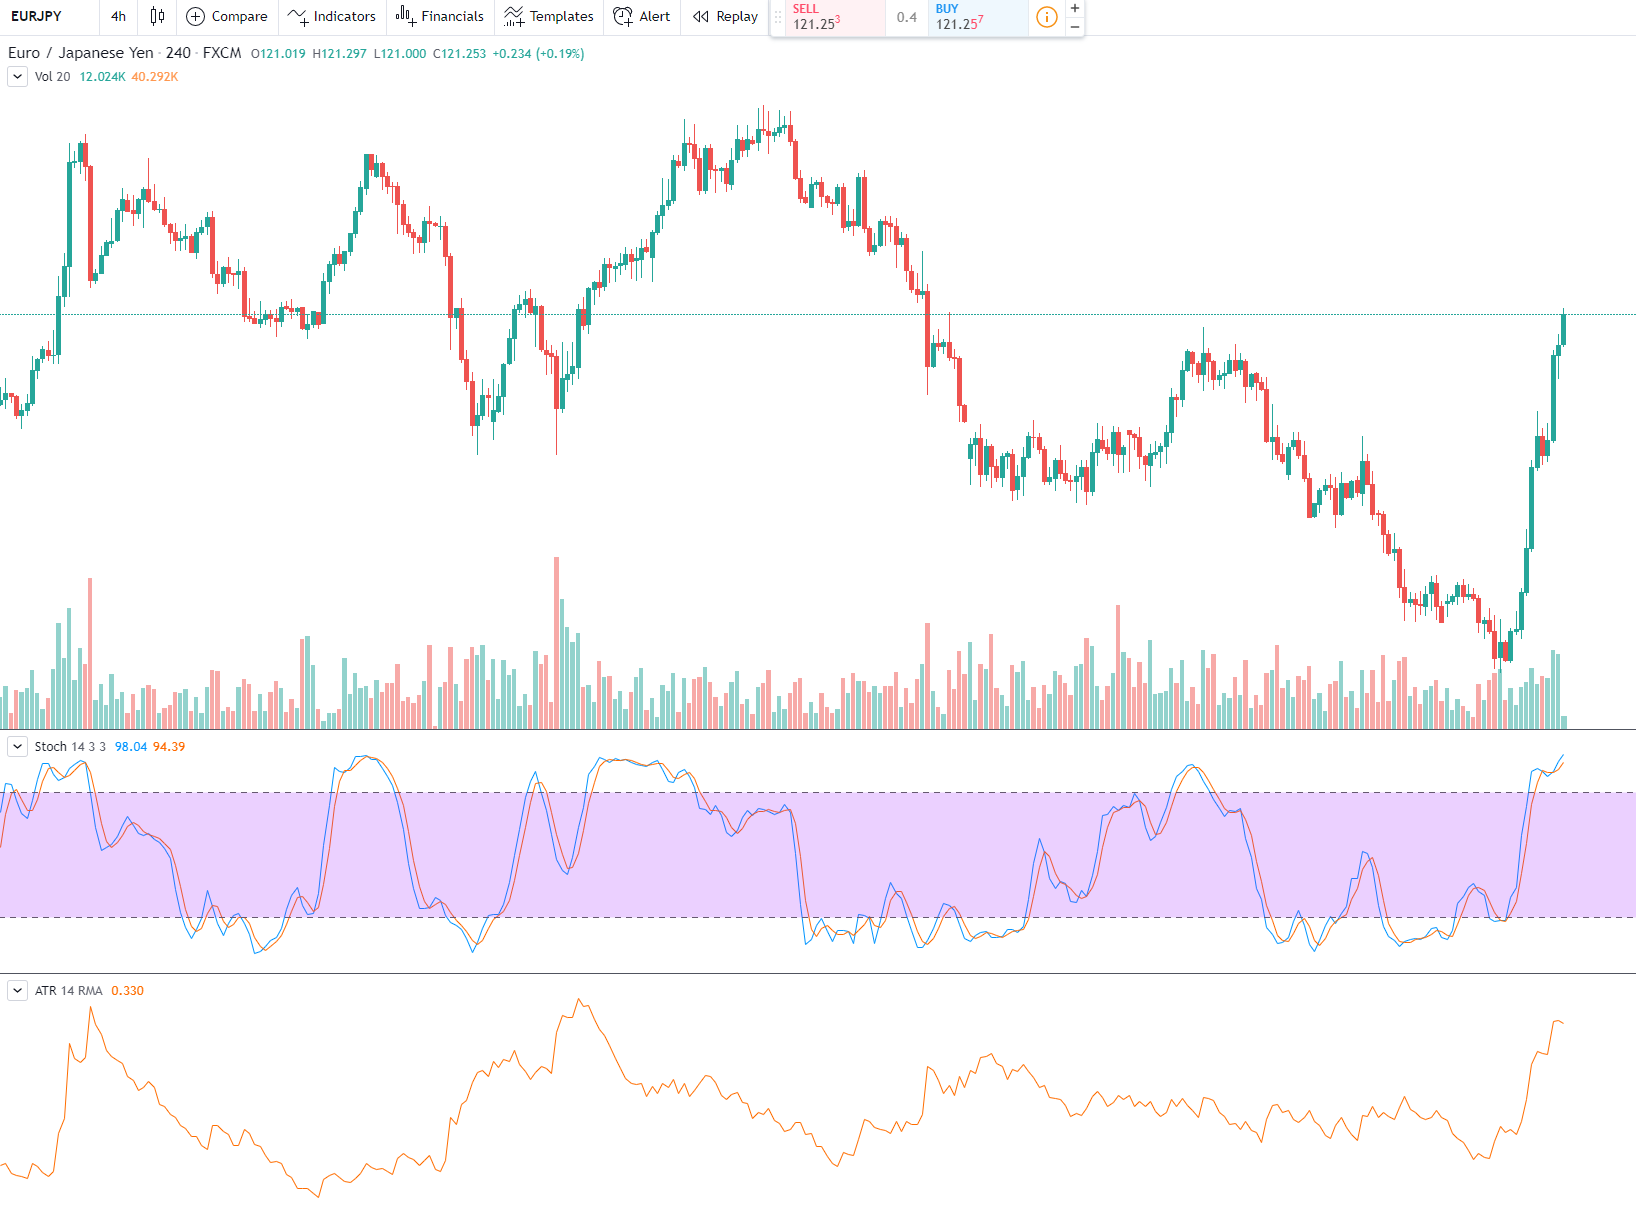
EUR/JPY overbought on 4H https://i.gyazo.com/4c4f606352a94bd616b3ad0007318dff.png
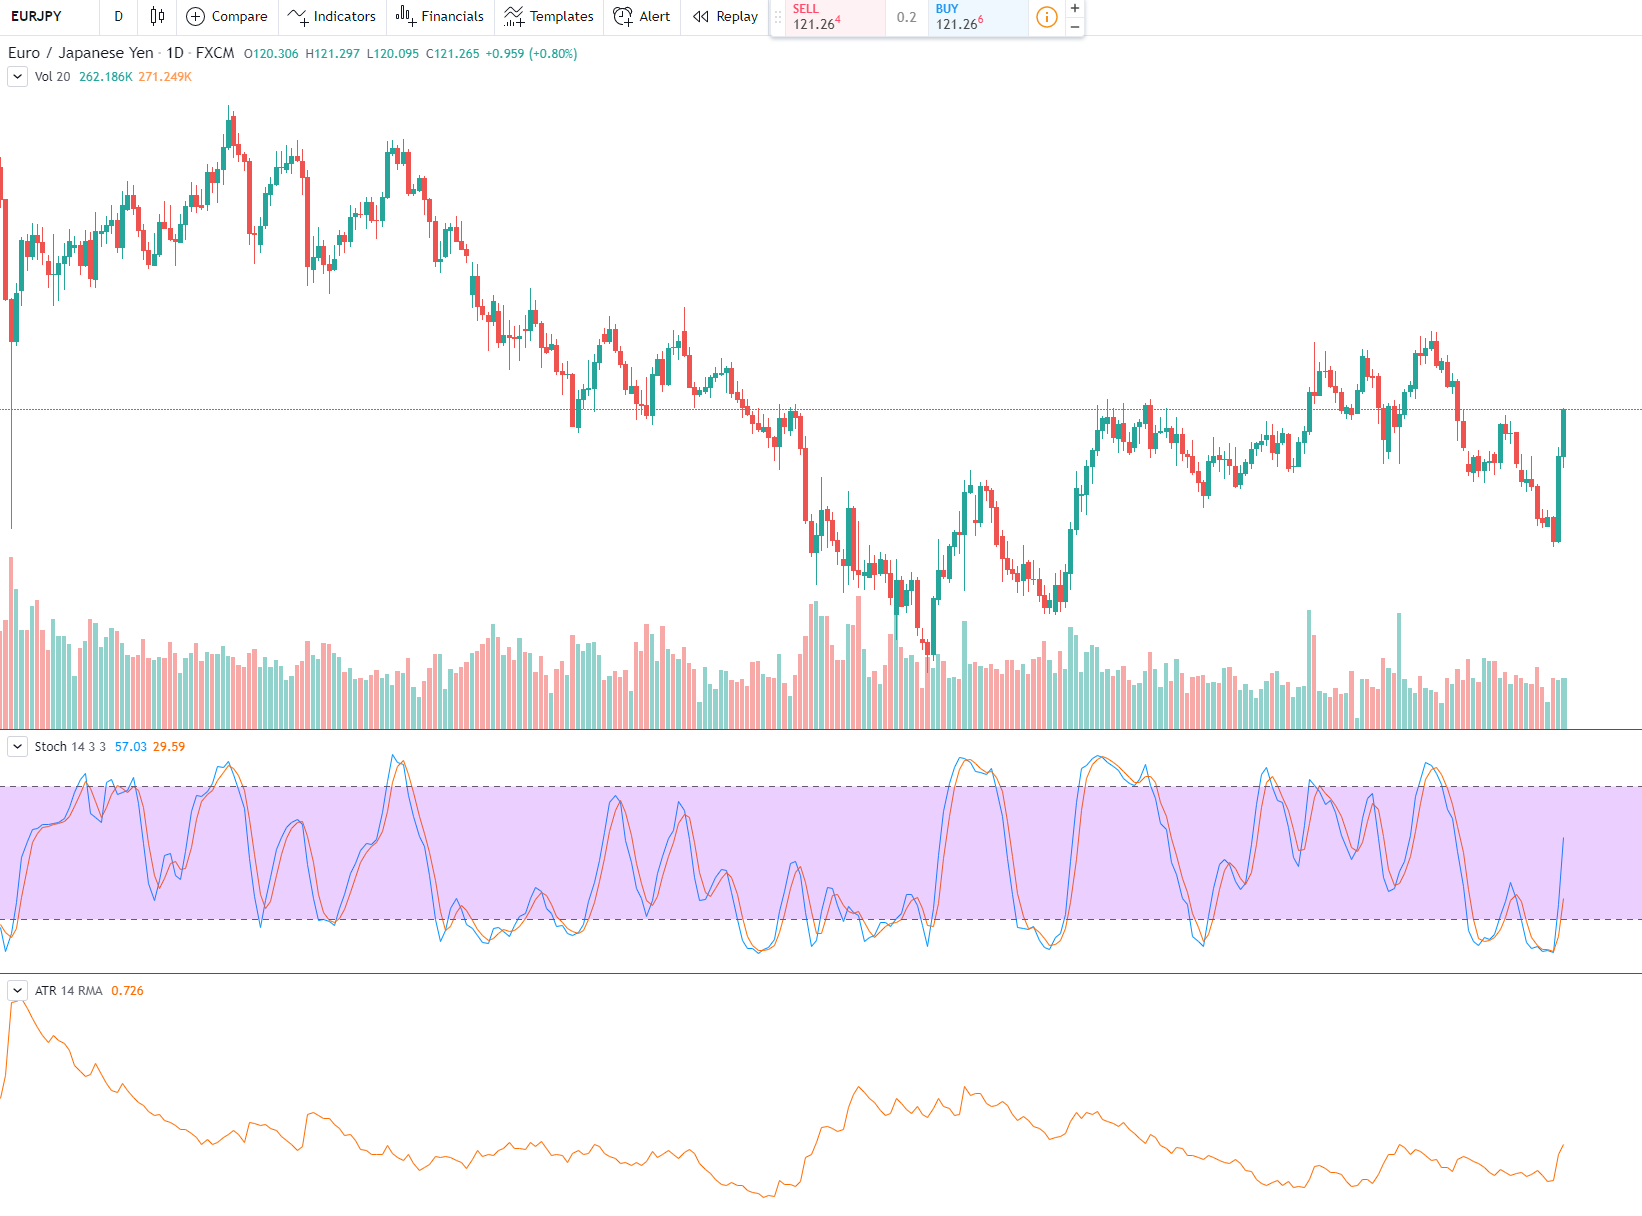
EUR/JPY just coming out from oversold on 1D https://i.gyazo.com/d121a209735a4b4cc916484adb23255d.png
So do I sell or buy? I literally don’t know which time frame to trust.
I can tell who not to trust - whoever told you that firstly you have to trust overbought/oversold indicators and secondly that before making a trade you have to check indicators in shorter time-frames than your trade strategy’s.
Your being whipped out by the smaller frames. Technically speaking EUR/JPY was oversold for me around the 118.596 mark and then was engulfed by a large bullish candle the following day. Right there my mindset would’ve been this is a cause for reversal and EUR shall MOST LIKELY rise which I did take a trade at the 120 level and have exited now.
I think you looking at the super small time frame won’t help because you’ll be witnessing a bunch of whipsaws and way more false signals vs if you used a longer time frame to get the BIGGER PICTURE of the trend that’s trying to play out.
@matty89 I think we have to get the forex trading perspective right first! Trading is a probability game, 50/50, therefore whichever timeframe you choose, you have the chance of 50/50 being right. Longer timeframe is for you to dictate the trends, up or down, but still with 50/50 chance. The shorter timeframe is for your timing of entry, yet still with 50/50 chance. So keep our trading simple with just one longer TF and one shorter TF. Don’t complicate our trading, accept imperfections in our trading strategy, embrace calculated losses as losing is part of the winning game, we have to learn to accept losses. Don’t over trade with too short TFs as trading is a minus sum game which will end up with losses not incurred by our trading results but by the commissions, spreads paid to our brokers! 
1 Like
As a trader of 17 yrs not once have I used multiple timeframes to confirm anything
Overated hocus pocus in my humble opinion.
Figure out what timeframe you want to trade from and just trade from it.
That might mean adding a trendline or whatever, but the less confusion will help you no end.
1 Like
You should be trading in the direction of the dominant trend. Which is the higher time frame.
If this is the way you want to go, consider including a trend filter like a moving average or the MACD.
For example, the moving average on the daily time frame is pointing up and price is trading above it.
Look for over sold conditions with your oscillating indicator on the 4 hour time frame to go long…
Then maybe, drop down to the 1 hour time frame to refine the entry even further.
Patience is also required for the right conditions to present themselves before trading. This should be a given.
You might want to look in to Alexander Elder’s triple screen trading system to get a better idea about what I am talking about. You should easily be able to find it.
In my opinion, trading using oscillating indicators alone is not enough to be consistently profitable. Without getting in to a debate about using technical indicators or not, I will just say, each to their own. But if it was that easy, everybody would be making money from trading.
Good luck.
1 Like
I tend to use oscillators to spot divergences rather than oversold or overbought signals as quite often the price will continue to move when it’s saying overbought or oversold.
Here’s my strategy. I draw my support/resistance and trend lines on the weekly and daily charts. I then switch to the 4 hour and sometimes the 1 hour to look for reversal or continuation signals near these lines. I look for price action signals (wicks, engulfing candles etc) and I look for divergence on normally the rsi or stochastics. This is working quite well for me.
You’re thinking too hard about it imo.
The greater scale usually gives you the macro trend, the smaller ones the micro trend happening within them.
If the weekly candlestick is bullish that doesn’t mean that all the daily candlesticks are bullish. There’s always pullbacks happening on every scale, and you can technically trade all of these trends on all the charts if you’re good. Sometimes I’ll have over 1000 pips buy trade on the weekly, then some micro selling and buying opportunities in between. The way I view it is that the macro charts (D,M,H4) gives you the main trend and the smaller ones (H1,30M,15M) indicate the pullbacks and fluctuations happening within the macro trends. The “Micro” time charts I found most useful to find your optimal entry point.
One of the best traders I’ve ever met gave me the best trading advice I ever got: “there’s no strategy, read the charts and trade”.
Both short and long time frames have their own importance. Just because they don’t fit your trading style doesn’t mean that they are not worth it. Your focus must be on choosing a time frame that fits your trading. Like I am more into day trading, I prefer a 5-minute time frame over 15-minute time frame.