Went short at the CBL as I thought we might be looking at some more stock market weakness today but looks like I jumped the gun. I should’ve been looking at things more closely and trading what was in front of me instead of trying to guess what was coming. Also there was a little bit of expansion showing in the Outer BBs at the time of entering the trade and I perhaps should’ve just given this one a pass. Rushed the entry without giving enough thought to the various factors. Trade was stopped out for a loss on both positions.
Total P&L: -78 pips
Total Account Risk: 0.98%
R/R: -1.00
Account Balance: -0.98%
Overall Account Balance: +17.86%
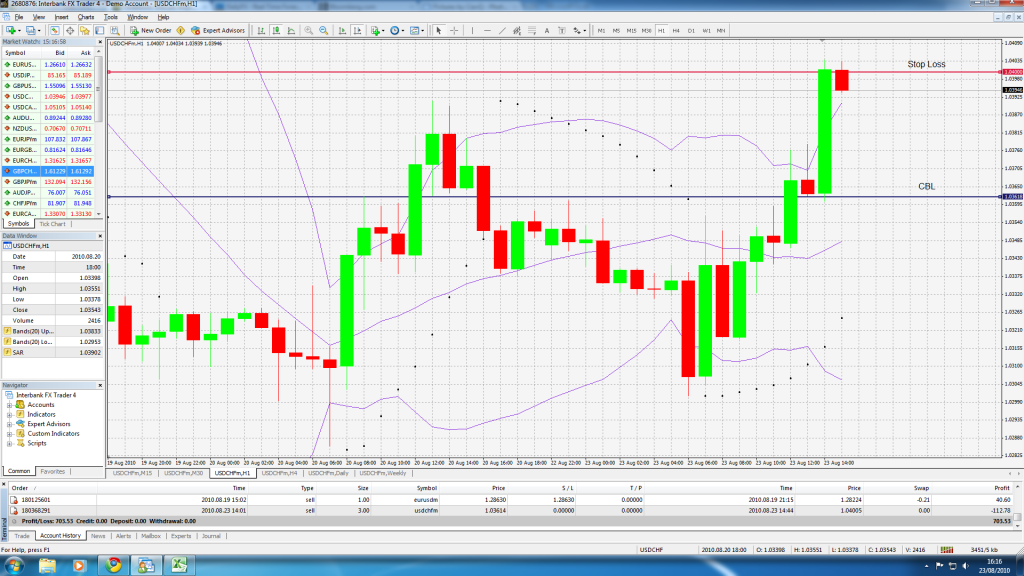
Went short with this pair at the candle after the Extreme Candle (2pm on the 23rd). At the time the Outer BBs and Mid BB lines were sloping up pretty sharply and the only reason I took this trade was that the stock markets were looking a bit shaky. Stop was drawn a little above the high of the Extreme Candle. Entered two positions - 2 mini lots and 1 mini lot.
Price went against me almost immediately after entry and I ended up leaving the trade run overnight once I saw that the Dow had closed down 30 odd points and price had started to come back around my way. Price dropped rapidly then during the Asian session and when I woke up this morning I decided to close out the both positions after price had entered into what had been a resistance zone last week.
Total P&L: +174 pips
Total Account Risk: 1.25%
R/R: 1.78
Account Balance: +2.21%
Overall Account Balance: +20.47%
I must have done this same darned thing about a dozen times now. After winning 10 trades in a row I think I have super powers, but after the trade I realize I was just blinded. I totally missed the fact that the opposite band was not contracting when I entered. It seems like such a small detail, but I guess it’s more important than it seems like it should be. In any case, you are kicking butt with over 17% profit and growing fast. Keep it up and you can buy babypips as a toy for your kids to play with
Hello. I have a question. I was thinking that your CBL was for the candle in the middle of this picture, but you entered short at the bottom of the longest green candle at the far right??
Zaboon - the CBL was drawn from the low of the candle just before the long green candle. That was the Extreme Candle at the time. It looked like price was then dropping below the CBL but I should’ve been paying more attention to the expansion in the Outer BBs. PA turned around and went up miles as you can see in the long green candle. The Outer BBs weren’t expanding as much as you can see in the original diagram as they’ve been repainted but was enough that I should’ve been more careful.
The entry from that point could be too early just like you said.
If this was on 4H, you could have avoided the loss I think.
I am not suggesting to use 4H though. 4H is probably the safest but I think it is slow to ride the wave, you know. And you have succeeded to prove 1H chart works with the total profit!
The band move you mentioned is something we all need to watch though when you try to enter RIGHT AFTER the squeeze as well as the angle of the middleline. The problem is that you entered too early!
But this is something I am trying to find out myself. And I have one way to help the problem, not to solve it yet! Next time try to check both 4H and 1H when entering at that kind of timing. By comparing both, I think you can see the band move much better.
just wanted to mention something… are you sure you are in position of giving advice to someone?
I say because I’m a newbie too and I’m sure I won’t try to give advice to anyone, and for sure not to PipBandit as his results are not good… are excellent! I would be embarrassed in case they ask me about how I am doing.
Just saying. I know you use a method yourself but I read you are still a newbie as a lot of us… if it’s not the case forgive me
The timing was fine. I entered during the candle after the CBL which pierces the CBL line. This has worked plenty of times for me already. However the Outer BBs expanding a bit should have alerted me to the possibility that it mightn’t turn out the way I was hoping. I saw them but pretty much ignored them which one incorrect part of my trade.
Normally I look to enter when the Outer BBs are level or contracting and the Mid BB is level. When I look to enter a trade I’ll usually scan across 15 min, 1 hour, 4 hour and Daily charts and try to take it all in. I’ll also look at how the markets are doing in general and see if that goes ok with the trade that I’m planning to take i.e. if the markets are taking a beating I’ll not be looking to go long EUR/USD even if it does retrace up some to the CBL level. I didn’t do this though as I was just back from the airport and jumped the gun way too quickly. By ignoring the Outer BBs and rushing the trade in general I was really lowering the probability of this being a good trade - which is exactly how it turned out.
Sorry. I only said it looked too early based on the way I enter. I forgot that you were following a certain way to enter there.
You can ignore my opinion but I would let the candle walk on the +2 band, not the wick itself, if I want to see the band-walk.
In my scenario of that, I want to see a candle body goes a bit beyond the band. Yes the wick itself works in many times too, but this is my method to make sure the trend goes the direction I want to see.
And I agree with you that if I am to enter around there based on the same candle you picked, I would think it would go down.
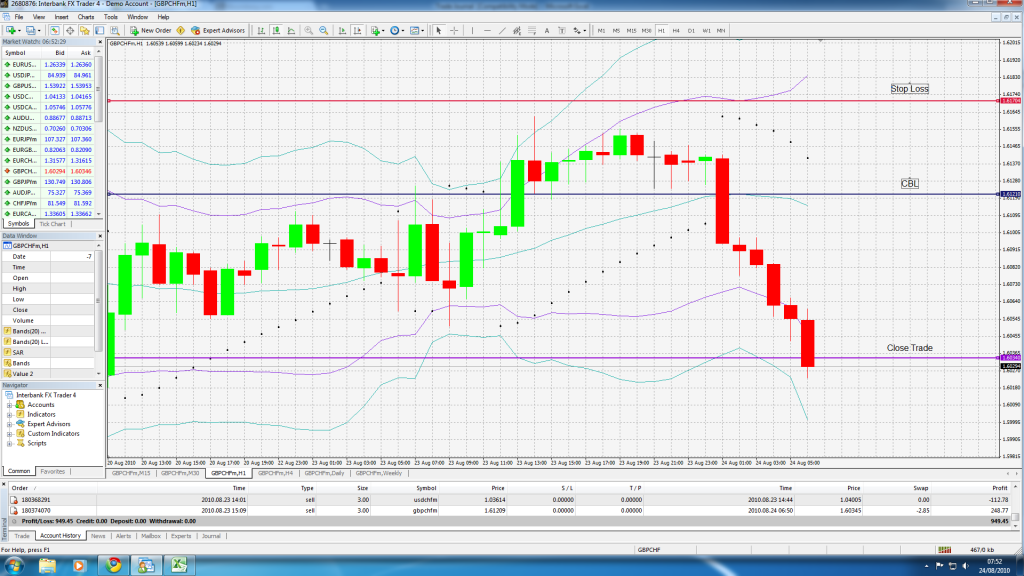
Been away from the chance to do some trading the past few days. Got some time this afternoon following the US GDP news release. Decided to go short after GBP had leaped up. Didn’t really see how a slightly less than expected revision to GDP is all that good a thing. Entered with a position of 3 mini lots. Stop was drawn a bit outside the Outer BB.
Decided to close the position out at the Mid BB as weekend is approaching and I don’t hold trades over that unless I have a very good reason. I’m expecting GBP to probably drop further but I don’t want to take the risk of a big gap over the weekend so I’m out just in case.
Total P&L: +26 pips
Total Account Risk: 0.65%
R/R: 0.50
Account Balance: +0.32%
Overall Account Balance: +20.86%
Hi pipbandit, great thread… im demo trading the Tymen dna method also, and flirting with the bb walk method…
i have mainly been trading the 30 minute tf, and i have to say it appears the higher tf’s really are more reliable…
thanks for all your effort, it has reinforced my belief that this is a good strategy if you follow the rules, and trading the 4hr/1hr tf’s gives you time to look at market conditions before entering the trade…
It tends to happen as people don’t want to spend time reading and learning, just food partially digested so they won’t have to work.
The fact is Tymen does not care about it… those who learnt the entire thread know what it’s about and on a personal note, there’s a lot of time put and being put into it.
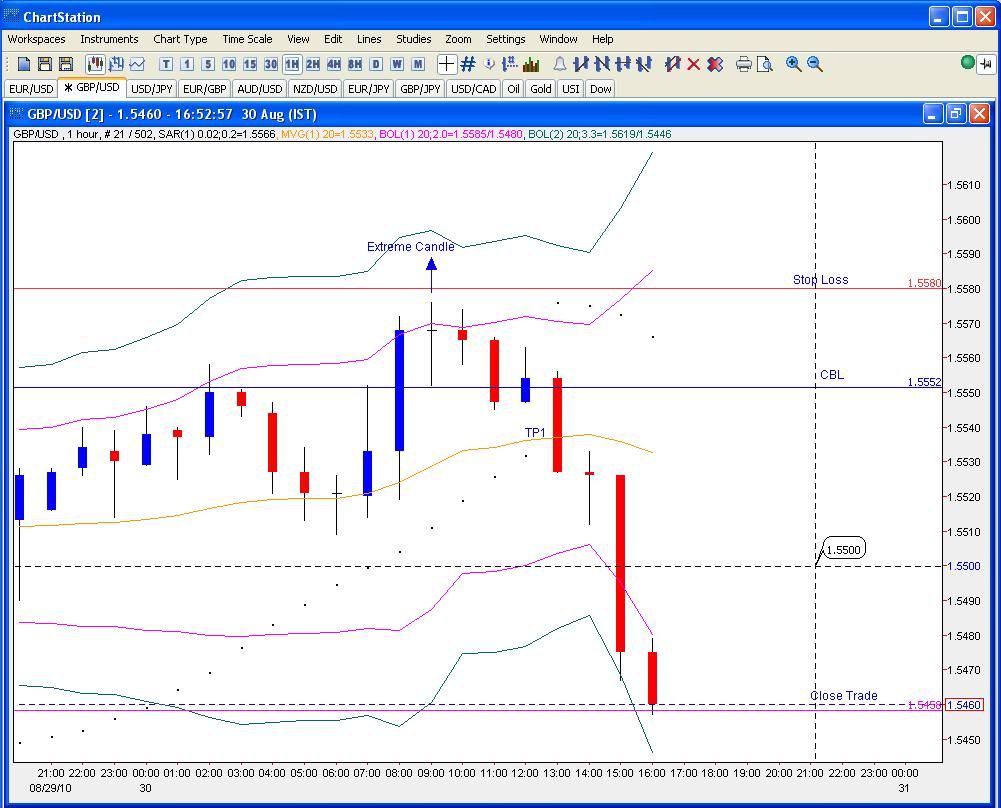
Went short 1 pip before the CBL during the first candle to pierce the line. Entered with two positions - one of 2 mini lots and one of 1 mini lot. Stop was drawn a little above the high of the Extreme Candle.
TP1 was hit fairly early on and closed out the first two positions for +13 pips. Price then dropped pretty rapidly and once it had reached the Outer BB it looked like they were expanding decently at this point so I stayed in the trade to see if I could catch a BB walk. I decided to close out the 2nd position once it got near to the 3.3 dev line for the 2nd time. Possibly jumping out early but I’m done for the day I think and I’ll take the profit to start the week.
Total P&L: +106 pips
Total Account Risk: 0.67%
R/R: 1.47
Account Balance: +0.98%
Overall Account Balance: +22.05%
Your log is very interesting, because we can see how successful system is the tymens and gravitons in reality. And we can see how you will grow to TRADER!
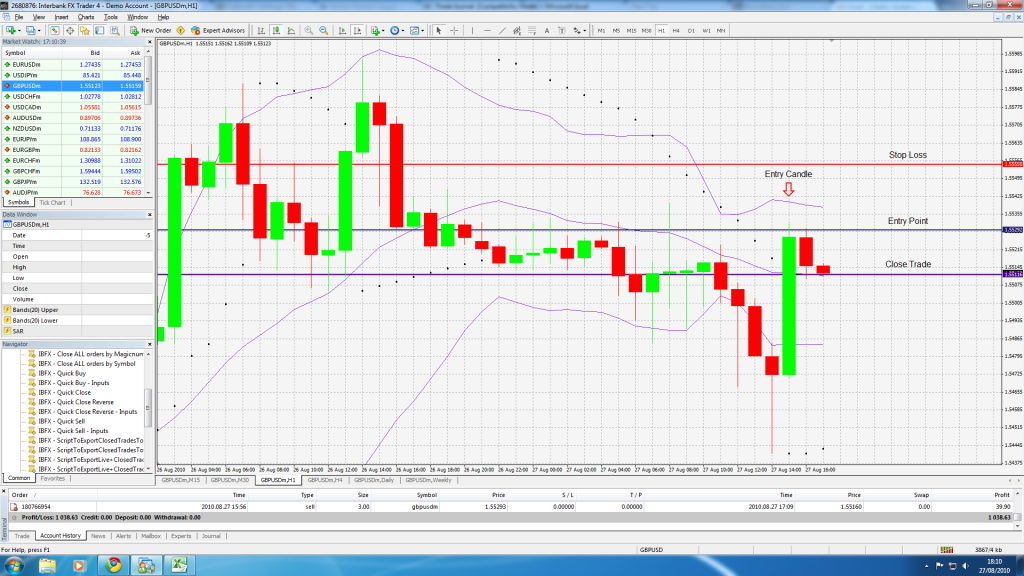
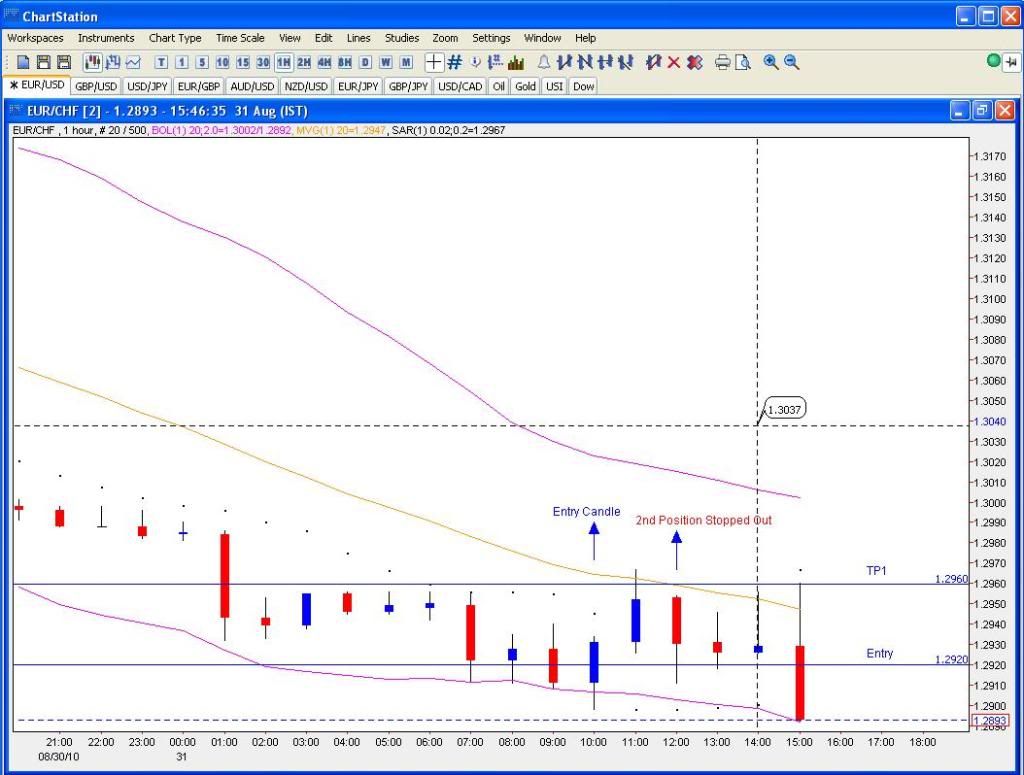
Not a true Bollinger DNA trade this one. Decided to jump in a little early once price had dropped down to near the 1.2900 level. Entered with a two positions of 2 mini lots each. Stop was placed at 1.2860 for a little breathing room in case a run was made at the 1.2900 level.
Price rose up towards the Mid BB and I closed out the 1st position there for +40 pips and moved stop to breakeven on 2nd position. Price then fell back again shortly after and stopped out the 2nd position. Price has now dropped down to the 1.29 level again and I’ve gone to try and play this trade out again. Looking a little iffy right now but we’ll see how it goes.
Total P&L: +40 pips
Total Account Risk: 1.97%
R/R: 0.33
Account Balance: +0.66%
Overall Account Balance: +22.85%