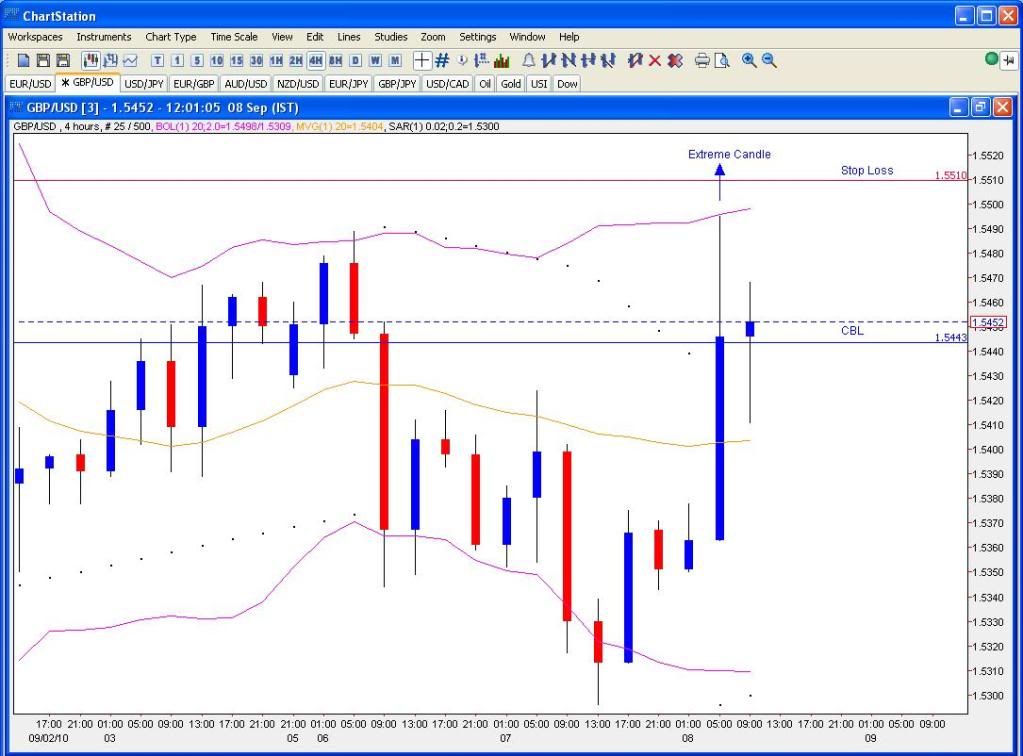
I’d entered the candle after the extreme candle once price was at the CBL. I don’t wait for the close of the following candle but at the same time I’m not entering just because the CBL has been pierced. I guess my choice to enter the trade or not is a little subjective as I’ll be looking across timeframes and at the markets in general. In this case I got it wrong and price dropped down to a new low before going up and then down sharply again and the new extreme candle made the trade look wrong. Should’ve exited sooner but glad I finally jumped out when I did.
Went short once price dropped back down through the CBL after the early morning GPB news events. Entered with 2 positions of 2 mini lots each. Stop was placed above the high of the Extreme Candle.
Price dropped down to near the Mid BB before reversing as the markets began to turn around. Ended up closing the trade at breakeven to continue my lacklustre week so far. Will monitor for a possible re-entry later today.
Total P&L: +0 pips
Total Account Risk: 2.09%
R/R: 0.00
Account Balance: +0.00%
Overall Account Balance: +28.21%
When the extreme candle takes up the entire (or much of) distance between the Outer BB and Mid BB Tymen’s method says you cut the extreme candle in half and draw the CBL from there. If you haven’t read his thread I’d say it’s worth a read. I think there’s a PDF by Hordane in the last few pages which summarises much of it all.
The idea of the CBL is that you’re entering once there’s been a significant retracement from the Outer BB towards the Mid BB i.e. you’re not trying to catch the exact point of reversal but trying to join in with a confirmed retracement (may still go against you of course).
In other timeframes I’m scanning across them to try and get an overview of how the market is looking. This will establish if the proposed trade is going with the overall trend or if it’s counter-trend. I’m a little more wary about entering counter-trend trades so I might look for some more reasons to enter the trade then in addition to the CBL being pierced.
I drew my CBL by taking the distance between the Mid BB and Outer BB and cutting it in half (more or less - I just eyeballed it pretty quickly as market was moving fairly fast). I didn’t cut the whole candle in half as this would have resulted in the entry being way too close to the Mid BB due to a good portion of the extreme candle being underneath the Mid BB. This allowed me to enter the trade once it looked like a definite retracement was occurring. Didn’t hit my TP points in the end but as stop was moved to breakeven once the retracement had gone on for a bit I lost nothing.
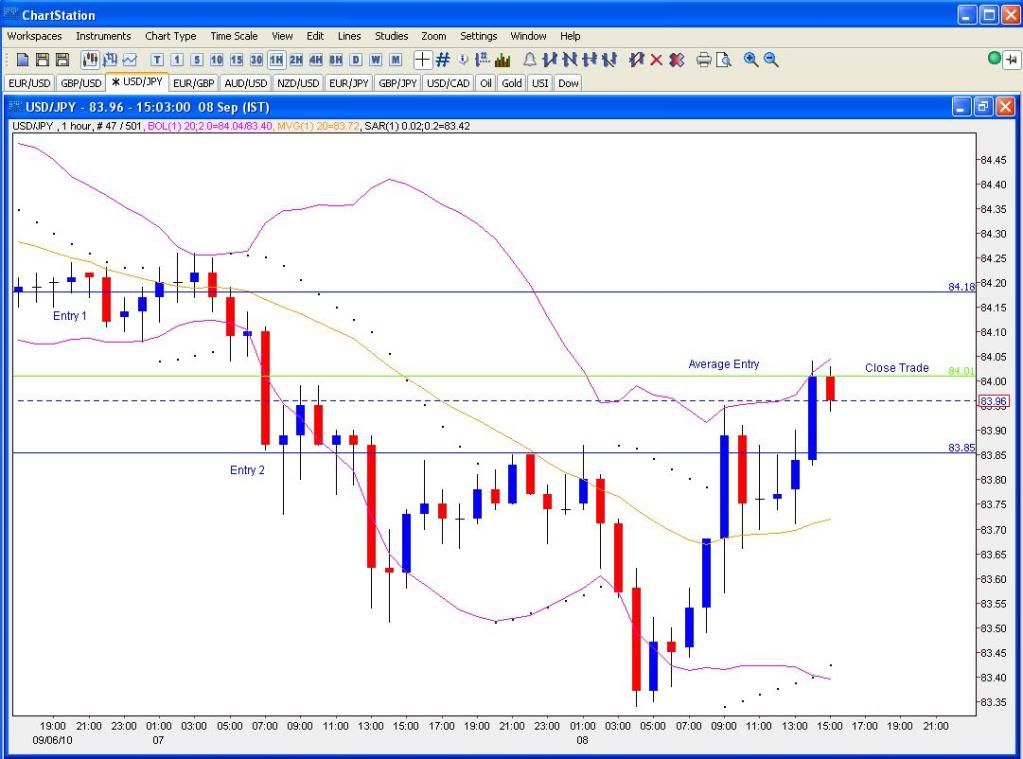
An object example of trying to predict things going wrong. Went long a couple of days ago at 84.18 and then again at 83.85 thinking that Yen couldn’t strengthen all that much more. Ended up with both trades tying up 4% of my account in risk overall and floating a loss of close to that for the past couple of days. A better reading of the markets and news would have kept me out of this trade completely and better trade management wouldn’t have tied so much risk into this one move. Anyway, today’s minor rally was enough for me to fortunately get out at breakeven and with a lesson learned.
Total P&L Position 1: -32 pips
Total Account Risk: 2.74%
R/R: -0.18
Account Balance: -0.50%
Overall Account Balance: +27.57%
Total P&L Position 2: +34 pips
Total Account Risk: 1.72%
R/R: 0.31
Account Balance: +0.53%
Overall Account Balance: +28.25%
I’m interested in knowing how you are calculating your Risk vs Reward.
For example, if you have a Stop Loss set 10 pips away from your position opening and have three lots. You are risking 30 pips. So to get a 1:1 ratio you need to make 30 pips.
Or are you just saying your risking 10 making 30 so it’s a 1:3 ratio?
I calculate my risk as the total monetary amount I am risking in the trade. I then calculate how much I actually make after closing the trade to get the final ratio.
For example last week I placed an EUR/USD long:
Entry: 2 positions - 2 mini lots & 1 mini lot
EP: 1.2836
Stop: 1.2800
Risk: €108.00 (36 pips x 2 + 36 pips x 1)
P1 Close: 1.2873
P1 Profit: €74.00 (37 pips x 2)
P2 Close: 1.2860
P2 Profit: €24.00 (24 pips x 1)
Total Profit: €98.00
R/R = 98/108 = 0.91 (or 1:0.91 ratio)
When using this method I’m not expecting to get a good R/R but I am expecting the Win % to be high. To be honest I’m not really concentrating all that much on my R/R at all and am just recording it for stats. I’ve been more focused on trying not to lose trades and just practice the method in general. At a later point I’m going to look at more multi-lot strategies as described in Graviton’s thread and these will involve me looking at my R/R more closely for adding and removing lots.
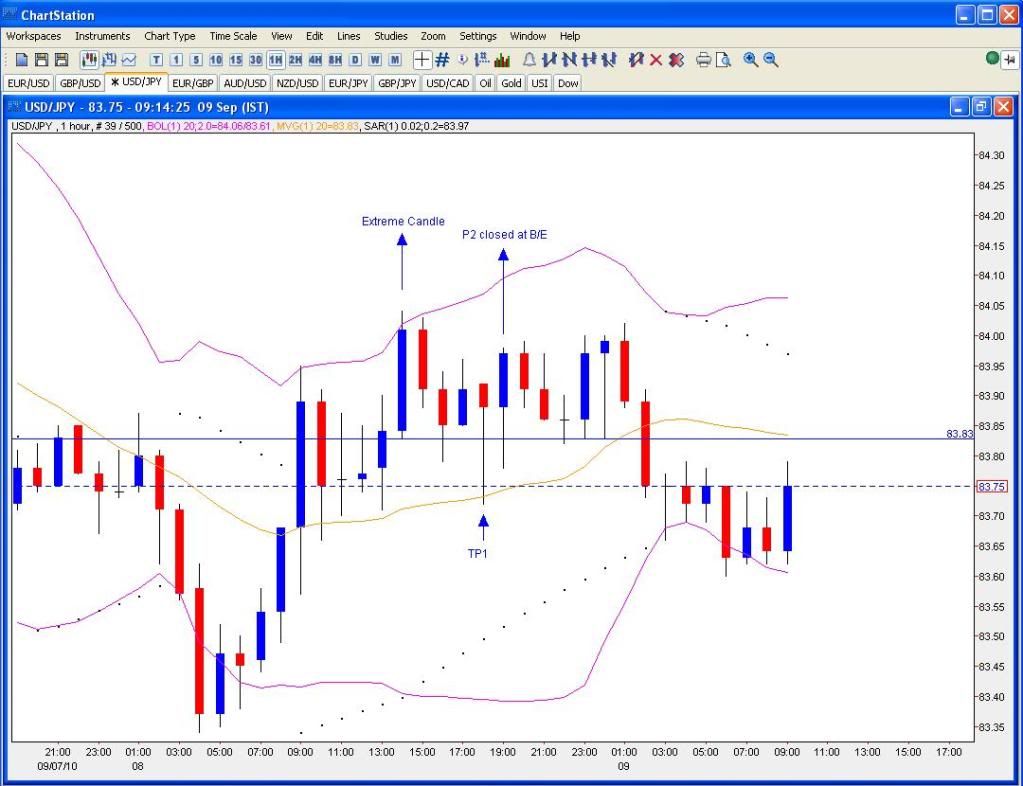
Went short at the CBL which was drawn from the low of the extreme candle. Entered during the 2nd candle after the extreme candle with two positions of 2 mini lots each. Stop was placed a little above the high of the extreme candle.
Price went with me, then against me, before dropping all of a sudden to the Mid BB where I closed the 1st position. Had to go out to the pub with work so moved stop to breakeven and let the 2nd position go. Saw later it was stopped out which wasn’t too unexpected given the small distance between my entry point and the Mid BB.
Total P&L: +10 pips
Total Account Risk: 0.81%
R/R: 0.19
Account Balance: +0.16%
Overall Account Balance: +28.45%
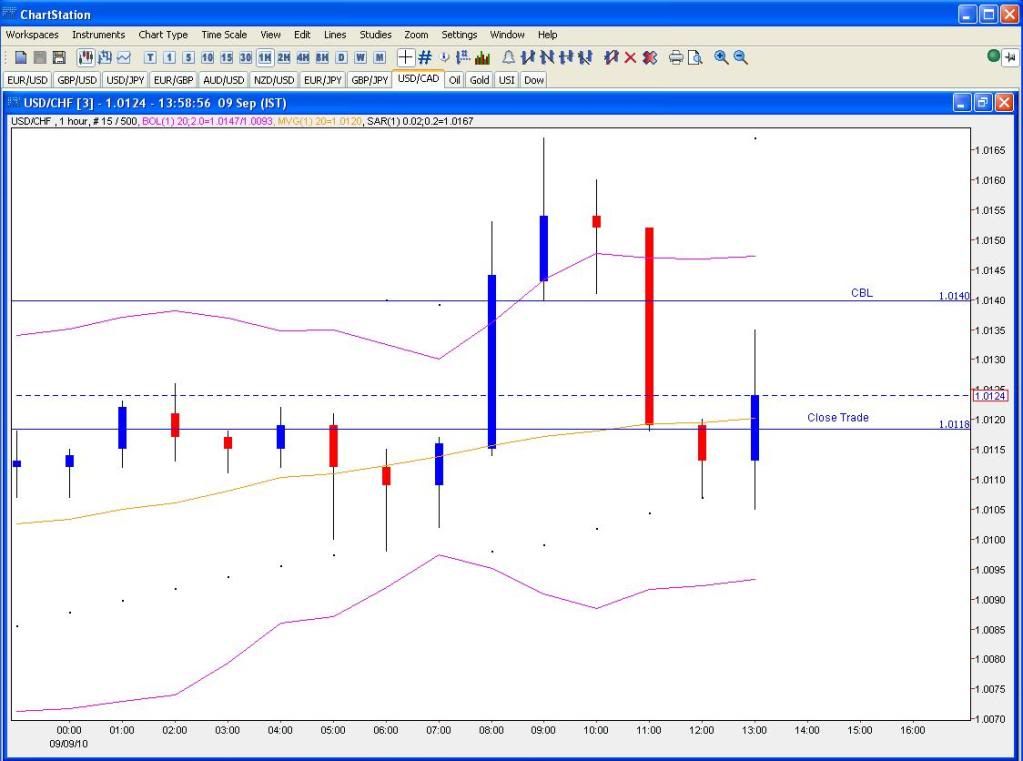
Went short at the CBL drawn from the low of the extreme candle. Entered during the 2nd candle after the extreme candle once price hit the line with two positions of 2 mini lots each. Stop was placed a little above the high of the extreme candle for some breathing room.
Price dropped down pretty quickly after entry and TP1 was hit fairly early on for +20 pips after taking spread into account. After the Initial Claims job data came out from the U.S. was somewhat positive it looked like USD would come back against CHF so closed out the 2nd position just over the Mid BB. Wasn’t really sure which way this pair would continue to go in the afternoon and with a long EUR/USD and long EUR/JPY trade open since this morning I figured taking a little profit now mightn’t be a bad idea.
Total P&L: +38 pips
Total Account Risk: 1.09%
R/R: 0.54
Account Balance: +0.59%
Overall Account Balance: +29.21%
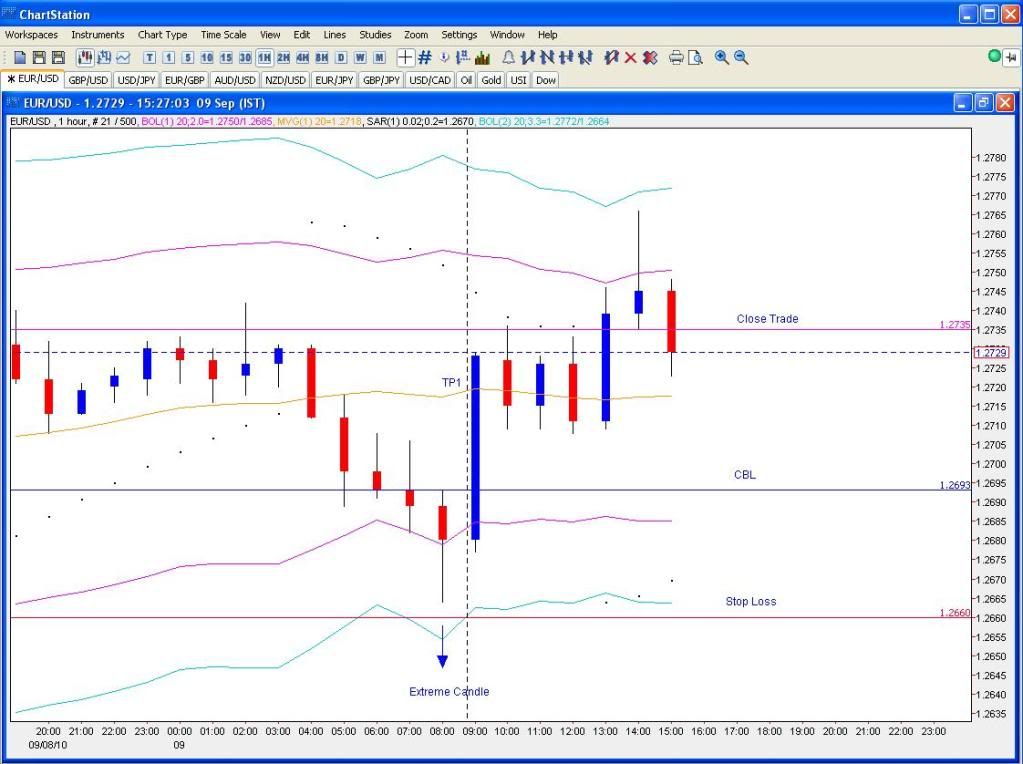
Went long with this pair this morning once price had pierced the CBL drawn from the high of the extreme candle. Stop placed a little below the low of that candle. Entered with two positions of 2 mini lots each.
TP1 was hit quite quickly after a bit of yo-yoing this morning. Dawdled along not doing much of anything then until the US jobs data. Spiked up nicely but when the Outer BB was hit it looked like some expansion was happening in the Outer BBs so didn’t close. This reversed however and I decided to to close the trade and place a short with the close trade line being the new CBL drawn from the low of the extreme candle.
Total P&L: +69 pips
Total Account Risk: 1.03%
R/R: 1.05
Account Balance: +1.07%
Overall Account Balance: +30.59%
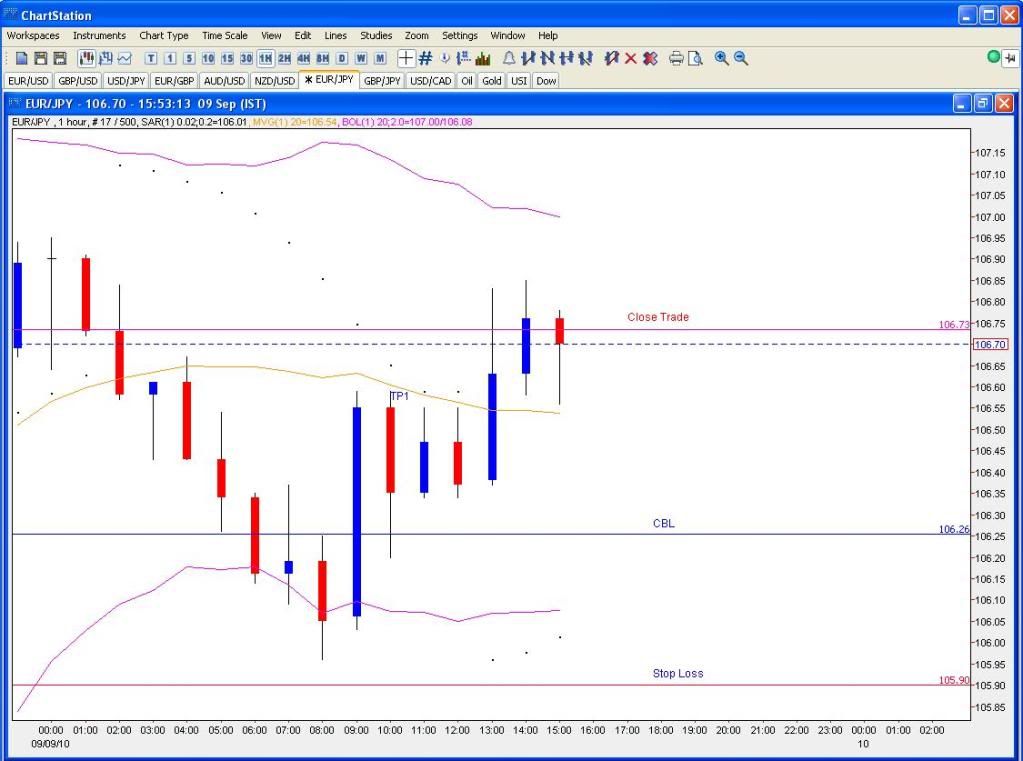
The other EUR long trade I placed this morning. Went long with 2 positions of 2 mini lots each once price had pierced through the CBL. Stop was placed a little under the low of the extreme candle.
Made some sizeable swings up and down before reaching TP1 for +30 pips. Good US data then provided the next upswing but looked like this had petered out so closed the trade a short while after the EUR/USD long. US markets are up but I’m not seeing much more of a follow through with EUR so I’ll take my profit and move on. Could well be proved completely wrong but had a poor week up until today so maybe no harm in booking some wins.
Total P&L: +75 pips
Total Account Risk: 1.17%
R/R: 0.99
Account Balance: +1.16%
Overall Account Balance: +32.09%
I tend to think trading in the squeeze area is higher success rate? When the price hits the middle, I sometimes exit to take the profit. Do you just stick to the stop line?
I identify my entries during squeezes as per the method I’m following. Success rate seems good with those sort of trades. I’m sure there’s other methods out there that probably specifically avoid squeezes so whatever works for you go with it.
I enter with 2 positions and close the first one out at the middle (Mid BB). This locks in some profit and I’ll let the 2nd position run after that. Pretty often I’ll move my stop to breakeven for the 2nd position after closing out the 1st position at the Mid BB in order to make the remainder of my trade risk-free.
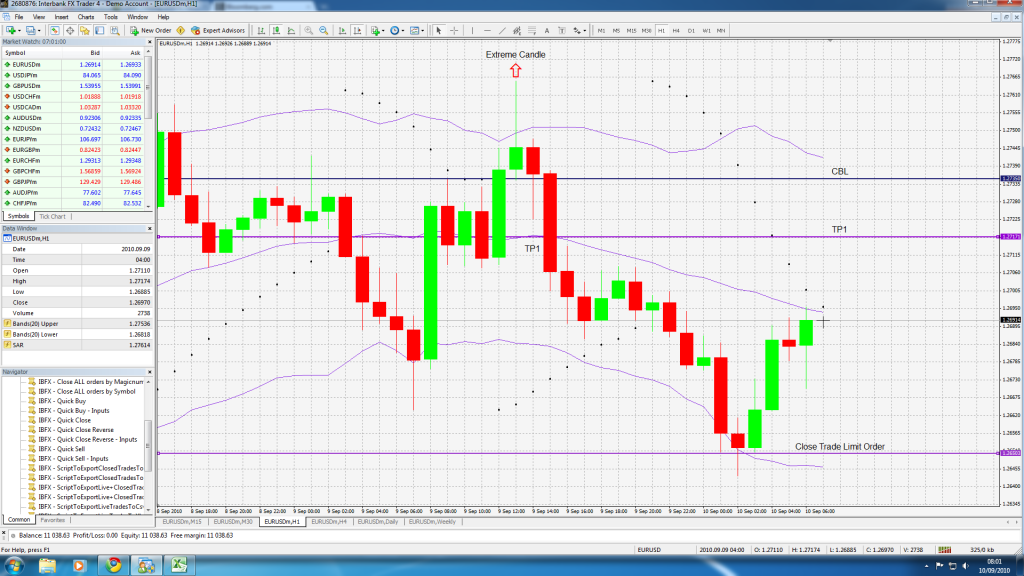
The follow up to Trade 66 before where I reversed course by placing a short at the new CBL where I closed the long I had open as it seemed to me that EUR strength was fading. Entered with 2 positions of 2 mini lots each. Stop was placed above the high of the extreme candle.
TP1 was hit relatively quickly and closed out first position for +18 pips. Let the rest run and moved stop up to breakeven once price had dropped down some more. Pre-Asian session price was continuing to drop but I had to go to bed so entered a take profit order at 1.2650 as this seemed like a decent target. Didn’t see much of a catalyst for more of a big drop down. Though this thinking has cost me some big moves before it worked out well for me today and woke up this morning to see the order has closed and price reversing.
Total P&L: +103 pips
Total Account Risk: 0.76%
R/R: 2.06
Account Balance: +1.56%
Overall Account Balance: +34.15%
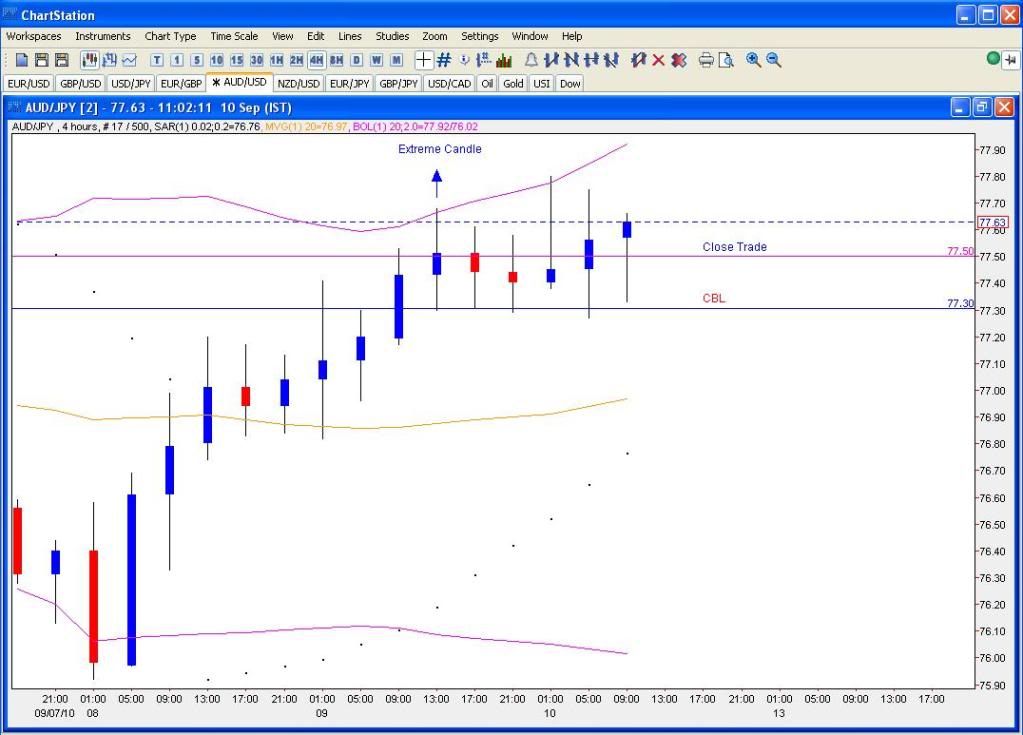
Went short with this pair last night once price had gone through the CBL after the extreme candle. BBs didn’t look as bad as they do now in the chart posted - appeared more level at the time. Entered with 2 positions of 2 mini lots each. Stop placed at 78.00.
Price didn’t display any real weakness overnight and as it started to rise up again this morning I decided to just get out of the trade for a bit of a loss. In retrospect I probably shouldn’t have taken this trade. Aussie was holding up pretty well before that and with the talk from Japan more Yen strength was maybe questionable. Waiting to see how it panned out would have been the wiser move.
Total P&L: -38 pips
Total Account Risk: 2.06%
R/R: -0.28
Account Balance: -0.57%
Overall Account Balance: +33.39%