Why the hush girlfriend? lol 
Get to work! 
~
GLGT
Why the hush girlfriend? lol
Get to work!
~
GLGT
I haven’t been doing so well so I’m sulking 
Not to worry tho…I’ll build a bridge and get over it. Boiled down to some personal family issues that hindered my focus…not good to trade like that.
Thanks for the wake up call 
I’ve decided to open up a few more pairs to consider. I will focus on the pair(s) where the market flow is in agreement on most of it’s timeframes. Tonight that would be the EURJPY which has a definate up flow on all timeframes.
I would hazard to say that there are 2 areas to look at. The first one is for price to retrace down to the circled 62% fib which is also the MS1, and a prior session low, at 114.80 (inst’l level). This would be with the main flow to trade long from there and is in the buy zone.
The 2nd option is the PDH at 115.20 (inst’l level). A short here would be against the flow, so it might be better to see if it broke that resistance and turned to support instead from which to go long. However, it’s not in the buy zone. It has reversed at this level a couple of times which may have weakened it and it’s ready to break, or it’s still very strong. I will watch what the volume of activity is when/if it get’s there.
The ADR is 88 pips. Yesterday was below that at 66 pips so today could be more.
Edit:
Price dropped like a rock and triggered my trade at 114.80. The down bar was scary looking but the general flow thankfully seemed to hold but I didn’t trust it so ended up closing the trade for +10. This morning then showed that price had reached up to the PDH and 115.20 and bounced down but unfortunately I didn’t have a pending order set for it. Otherwise it was a small success 
Hey sweet pip,
Nice thread. I have been trying to learn ICT’s method of trading as well although you are far mored advanced then myself. I noticed in your first post that you mentioned scalping before you started doing these swing trades. What made you change your style? Any general thoughts about your progress as a trader from the start of your trading till now?
Keep up the good work. ill be lurking around;)
Miss ya and your input :}
Hi Slowman, appreciate your support.
Unfortunately I have been struggling to apply this method consistently when adding more and more parts to it. Aside from some personal issues that makes it difficult to find time to analyze, markup and post some screen shots these days and get any feedback for what I might be missing, I think I just kinda got lost with it too…especially with the part about being able to determine the high/low within the first 4 hours of midnight EST. Setting pending orders that trigger while I’m asleep have mostly not worked out either.
Like I’ve mentioned before, trading during the Asian session is not the most ideal time to trade, and trading any other is just awkward and interferes with my sleep pattern which enables me to function with events and others in my time zone.
So I’m getting back to a simpler approach that is still based on following the smart money in terms of riding their coat tails in the short term as they move price from/to areas of S&R, specifically in daily ranges of 100 pips or more, using rather tight stops. The method comes from a thread at Forex Factory by Nomask entitles “Trading Major Lines”. He uses 1000 pip ranges on a weekly chart, but I’m hoping to adapt it to 100 pip ranges on the daily.
The Asian session mostly consolidates until the London session, but there are times when it can really moves early in the session…depends on the news schedule. This method seems to be able to take advantage of either.
I’ve tried this way a few times last week and this week and finding it offers up better entry opportunities in the Asian. The method has very tight stops (approx 10pips) to reflect the saying, “cut your losers short, let the winners run”. So I can expect and accept there to be more losers until a winner happens, but the R:R should more than compensate for the poor win ratio.
I haven’t worked out all the details yet, but that’ll be the purpose of this thread and will become known over the next couple of months.
I’ll be using the daily, hourly and 5min charts, candlestick pattersn being the engulfing, dark cloud cover, piercing line, and pinbar type varieties, as well as key fib and S&R levels.
More will become apparent as I endeavor to post up some charts …which unfortunately won’t be tonight as we have the Canucks hockey playoff game with Nashville…GO CANUCKS GO!, then I have to go to my moms to proof read the invitations back from the printers for their 50th wedding anniversay that’s next month.
Just thought I’d give an update
Of course a little VSA couldn’t hurt, but keep it simple.
Seems you are going the way of so many traders that manage to stick around over 2-3 years, dropping indies and complex strategies and looking at s/r, fibb and candles. Many pips to you, good luck.
For the last 2 weeks now I’ve been able to focus on and follow my plan as outlined in my previous post, and managed to have a positive outcome overall. I am going to keep forward testing for a few more weeks to practise the routine of it and to build more confidence in my analysis.
I think the EA I made to manage orders for me has greatly affected my confidence level with trading in general. [B]Before[/B], I would set stop loss and take profit points, and let fate take it’s course. [B]Now[/B], I’m moving the stop to break even at certain points, taking partial profits at certain points, and using a much large R:R ratio. Before, I could never really do that manually because of circumstances that didn’t allow me to be at the computer when those points were reached, and usually what happened was my take profit would be missed by a pip or 2 before price reversed back to hit my stop… which was still at a loss. I think we’re all pretty familiar with how disappointing that is! Now that’s all changed.
I hope to post my next week’s analysis and trades in more detail, and to hook up my demo account to mt4pips again to keep it accountable.
Shake the dust off and get to work chic 
My routine these days is to check the daily charts for candlestick patterns mainly being pinbars and engulfing. These candles signify reversals in bias, and until a new one appears, the bias will continue. Upon reviewing the closing of the daily candles over a selection of pairs, they all seemed to be doji types or other words, indecision. The pair that gave me the clearest bias was USDCAD for a downward bias. The flow on the majority of the timeframes is down, and price is below the 60sma on the Daily, hourly & 5min collectively. So down to the hourly to look for the same candlestick patterns on that timeframe. Here, a very pronounced bearish engulfing candle formed starting at the 50% fib of the previous daily bar.
Now I wait for price to get to 20 pips in profit and my EA will move the stop to break even. My auto S&R indicator has a support area marked around .9518 which is also the 127% extension of yesterdays range…so that’s where I will set my profit target for 50 pips.
As what happens, my stop at BE gets hit and this one just touched it before heading back down for a 80+pips. Unfortunately my EA is still under construction, until I can get the code right to close a portion of the order, so this time I didn’t get anything out of this trade, but I’m just happy to know my analysis worked out, and I didn’t lose anything either.
Finally got off my butt and setup a pic hosting account…much clearer now
This chart is of AUDUSD. I picked it for now because of the nice support turned resistance look to it. The lime green line in the middle is 1.0373… last week’s low… the dark green line just above it is a monthly low… and price dropped through them both and has now returned. The short orange line is yesterdays high so lots of confluence in this area including psych number 1.0400. I have a pending sell order there just based on all that. By the time I opened the chart, price had already reached and moved out of that zone, so in case it doesn’t do a double top, I will be watching for another opportunity to go short further down.

So that trade didn’t materialize unfortunately before I went to bed, so I cancelled the pending short because I don’t like leaving trades to trigger while I’m asleep anymore…price action can change too much against during that longer spell of time without my knowing.
Later on, when I came home for lunch, price had finally made it’s pullback with a nice pinbar that I was hoping for, but I had just missed it by 50 pips by then and I didn’t want to chase it.
Tonight, price just hasn’t reached any significant S or R zones yet…that I have mapped anyways… or with clear direction, for me to work with, and it’s almost time for bed again…sigh.
Hi Sweet Pip,
I was looking at potential shorts on AU and NU as well, but they didn’t quite reach my desired entry points. Do you think the two pairs will continue to fall in the coming weeks? Or do you think that risk appetite will pick up soon?
Hi Pipballer,
Well I’m no fundy analyst whatsoever and price will do whatever it will in spite of what I think…lol.
From a technical angle, I check the weekly chart for candlestick patterns to help guide my “bias” for the new week. At this point, both pairs are showing a pretty convincing looking bullish pinbar (hammer). A method that I’m loosely modelling after has a rule of thumb that if on a weekly chart, price crosses down a major round number and closes above it, then the bias is up the following week. Not to say price won’t head down somewhat at first, and we still need to be open to that possibility too.

You can see that price broke up through .8000, restested it, and held above. The theory is that price will now try to reach .9000

AU on the other hand has already reached 1.100, twice, so it may try to break it if tries again.
We shall see
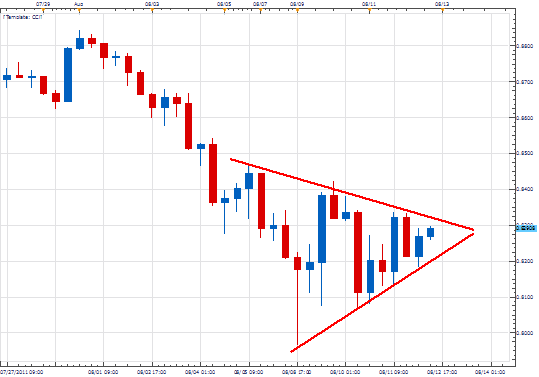
Regarding NU, just read an analysis on DailyFX of a symmetrical triangle that can be seen on the hourly up to the 8HR. Their prediction is that price then may continue to fall. You can read more about it at their site Forex @ DailyFX - NZD/USD Develops a Symetrical Triangle Pattern

hi, sweetpip, newbie here, read some of your previous threads in this forum, just wondering, are you not using harmonic price patterns anymore? any reasons y?
Hi dtpips…welcome to Babypips
No I’m not using them so much anymore unless I see one that is nearing completion, but not that I’m looking for them. Reason being, they seem to have a higher fakeout rate during the Asian session which is when I trade. Generally they work out better when I’m sleeping, or at work, but I really don’t like to set pending orders and go to bed and not be able to see the price action leading up to completion in case of those wide range bars when there are a few possible D targets which doesn’t usually work out too well for me either. I still use fibs a lot, a sometimes couple of sets at a time to see if an area I’m interested in has any confluence between them …just to get some added confidence to open the trade.
sweetpip, thanks for the info. that makes sense then
where can i get this “auto multi-timeframe S&R lines indicator” you were talking about?
I made them myself and I think they’re working properly now after having some time to tweak them and learn better how to program in mql. You can try them if you like.
The MTF_S&R_High_Low indicator draws lines at the highest and lowest price on a rolling monthly, weekly, quarterly & daily basis.
The MTF_S&R_Zones draws lines at swing points as detected by the zigzag indictor on the monthly down to daily timeframe.
The colors represent:
Green = Monthly
Lime = Weekly
Orange = Daily
Red = Quarterly or H4
Yellow was for hourly or sessions, but I took it out for now. If you know coding, you can unblock those lines and recompile them.
If you’re viewing the hourly timeframe, you will see all the colors representing the higher timeframes. However if you’re on say the weekly, it won’t draw the daily or H4 colors because they’re irrelevant there and just clutter the chart needlessly.
Let me know what you think.
mtf_S&R_Zones.zip (2.48 KB)


