Thank you Muthu & I will start with Google. Yes, always respect a promise - given or taken.
dobro,
I’ve attached a free support resistance indicator similar to muthusai2000’s. It has been kicking around different FX forums. I think it’s titled “Support Resistance by Barry”. I believe it works by picking the support/resistance levels using MT4’s fractals function. I really like it and hope it’s something you can use.
Don
Support and Resistance (Barry).zip (718 Bytes)
Don -
Thank you very much and it will be put into use. I tried to get the one Muthui uses and was sent to two different sights but the last one must have a bug as whenever I clicked on the indie download it just opened another home page. thanks again, D.
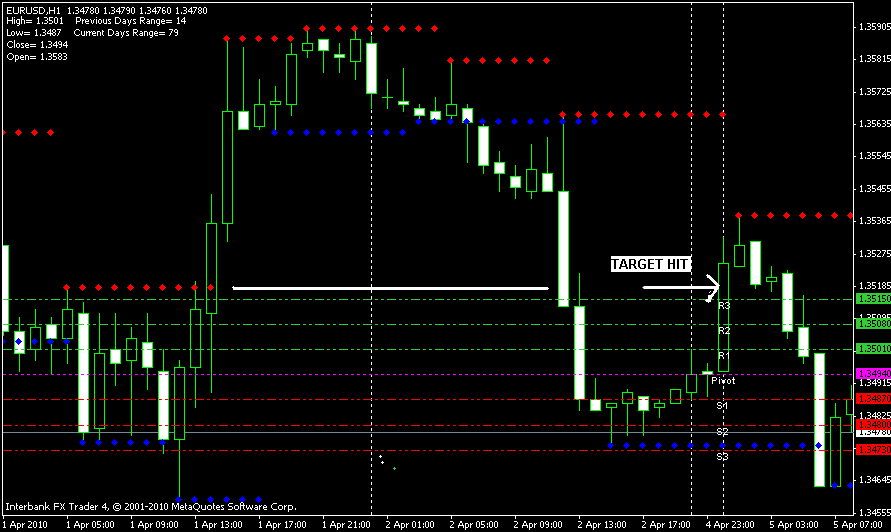
The “W” that was in its early stages whenwe made screen shot over weekend, panned out very well as can be seen from this chart. As far cable. It did move as we wanted. Unfortunately the market had a gap of 60 pips, which means, If we had a long before marked closed last weekend, we could have made profit. However, i do not like the idea of keeping trade open over weekends, especially with Cable.
Regards,
Muthu.
Chennai.
India.
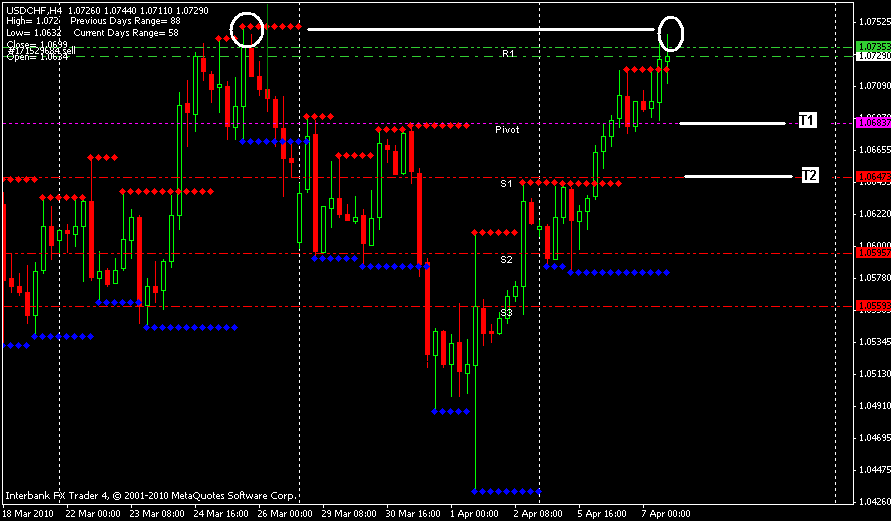
This is my plan for this pair. Lets see how it goes. I have entered the trade at this point of price action. Stops are ten pips above the high. T1 and T2 are Marked. If T1 is reached, I may trail my stops.
hi muthu, thanks for posting the charts.
i didnt understand the entry price action. its at prev high and also a resistence point. but dont we wait for a reversal ? and a confirmation ?
i would have waited for a red bar and close below that doji candle. just my view
When I looked at the chart it was a bear candle and i entered just as price moved up to get a better entry. However, it didnt work out and this trade took my stops.
Regards,
Muthu.
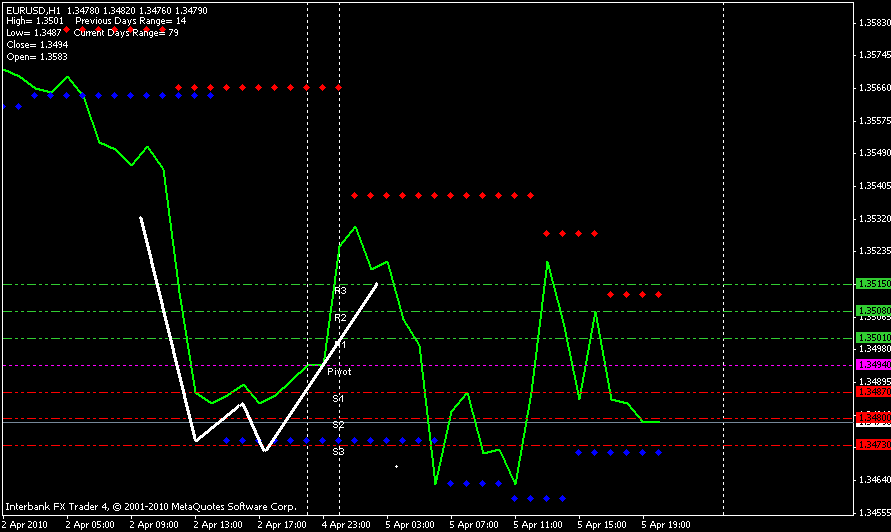
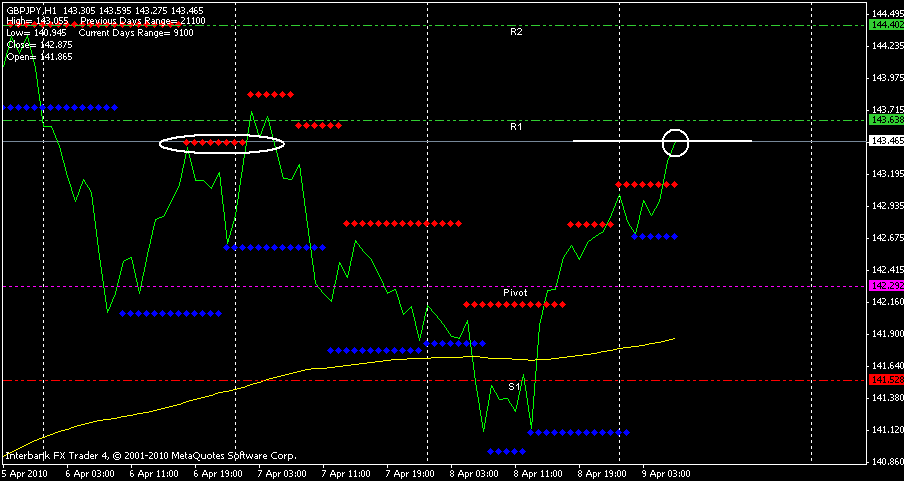
Line Chart price action trade for today. Price was in a range for the past few hours and forming a “W” with higher low and just broke the resistance line. Entered long as marked in the chart. Target area is also marked with a white line.
This is how the trade went and it hit our target at the resistance area as marked with a white circle.
Regards,
Muthu.
Chennai.
India.
Is your “line” in post #270 (in place of candlesticks or bars) a special indicator or a stock one found in MT4? I poked around FXDD’s MT4 and couldn’t find it. It does make finding the “W” much easier so I would like to try it. thanks, d.
Its the regular “line chart” icon that you see on any MT4 platform’s tool bar. Let me know if you are able to find it. If not i can post a screen shot for you.
Regards,
Muthu.
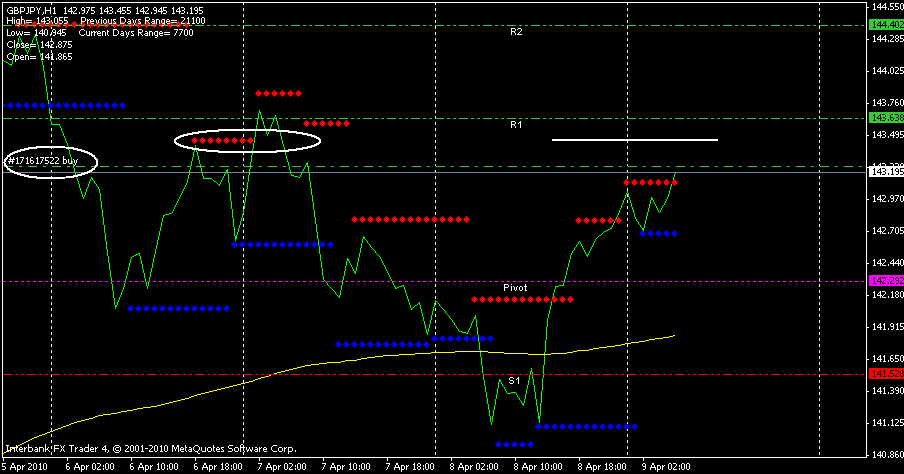
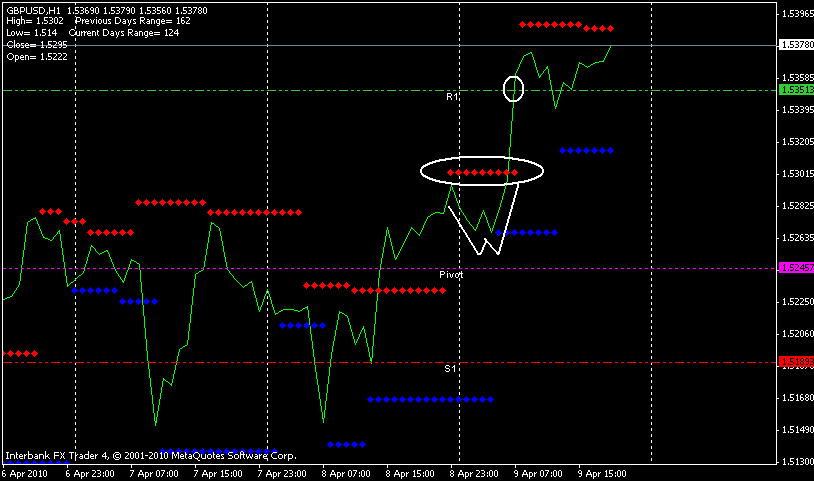
A replica of the setup that we traded with GJ happened with cable as well. Price action formed “W” and broke the resistance as marked with white oval to move up. I didnot trade this setup as i was looking at GJ at that time. However, i want to post this as it will help us learn this setup. I also wanted to know if MasterGunner is ok to post these W setups in this thread as I do not want to deviate as it is his thread.
Regards,
Muthu.
Thanks Muthu -
I was looking in the indicators, EAs, etc. I hate it when something hides in plain site!! d.
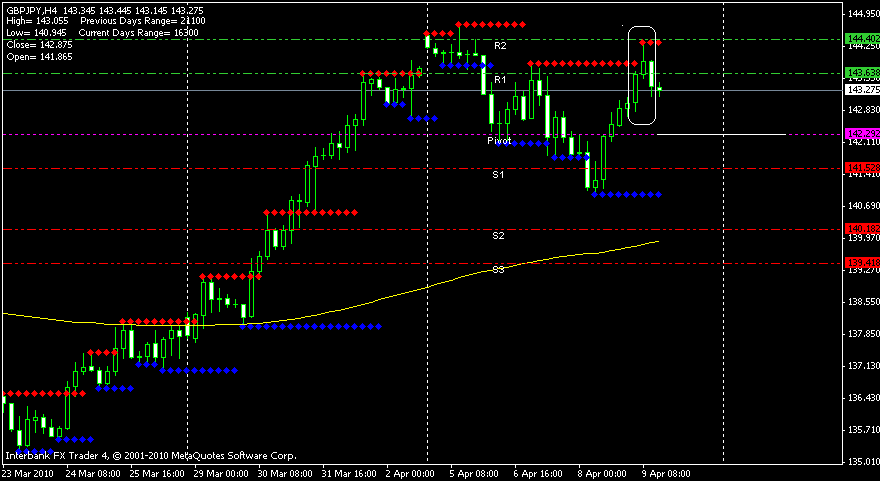
I will not be able to trade at market open as it starts at odd hours local time. However, this is what i see at maket close last week. Pair GJ H4. A possible Evening Star pattern has formed and i will wait to see how price action behaves and if it breaks the low and a possible short trade at break of low. Target area is marked with a white line. Stop ten pips above the wick of the third candle in the pattern.
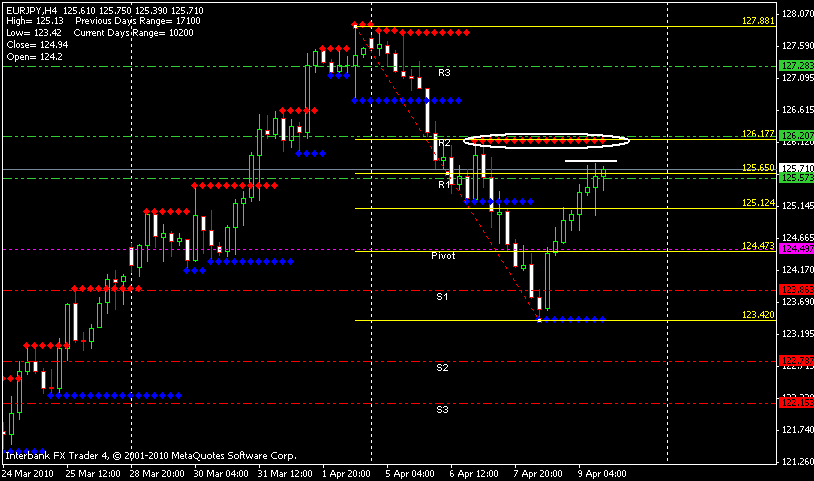
Price is retracing and is stalled at a mini resistance level as marked with a white line. If the mini resistance holds a good area to short this pair. A better area to short is the bigger resistance level marked by white oval. If price holds at this resistance area and retraces possible target areas are fib level 125.12. Lets see what holds for monday.
Regards,
Muthu.
Chennai.
India.
Thanks for the head’s up Muthu.
MasterGunner - how have you found D. TF trading? Probably less stressful with more free time but are you making more? I only look at the Big 6 so the D. often shows nothing very viable. Just curious. d.
Less time for sure. Profitability is about the same if not a bit better. I look at 19 pairs, so there generally is some action going on. Very rarely am I not in the market. Right now I am in three trades with a limit order pending to enter into a fourth.
19 prs - whee! Not sure I could handle 9 prs but I know I have to expand some as 6 just leaves me out of the market too much. I still look at 1H and 4H, sometime 3H on Oanda, but D. gives me a lot more time to consider all of the variables before entering, easier to plot and plan so to speak. Thanks for the reply, d.
One vice I have is my need to always be in the market. When starting out it worked against me as I was always sitting in front of the computer forcing trades. Peeling back to daily charts and watching more pairs overall provided an environment that suited my trading psychology.

