A little moral support.
Ok:
Here’s something I have “brewing”.
-
The first picture is of the USDJPY 4HR with a 50 SMA that gives me a quick look at the current/near term trend. The trend is my friend so I am looking to sell.
-
The picture shows the daily zoomed out. I like to use supply and demand levels as taught by Sam Seiden so the next picture is of my effort to look for the nearest low pivot point/stronger demand area on the higher time frame. I want to sell, but I don’t want to sell dab smack into a higher time frame demand level (support) without leaving myself any profit margin. My reasoning is that the higher time frame support and resistance is stronger than the one I’m trading on. Just imagine driving a car 100mph right into a brick wall, and you’ll catch my meaning. The relative near term low/demand area/pivot point on this time frame happens to be at the 84.82 level. This is a great distance away from current price, so I still look pretty good to sell.
-
See the thrid picture. I like to trade from the 30M and 1H charts so I scan them both for “rally-base-drop” (Seiden). I like what see on the 30M as the best setup. Why?? Because of the rally-base-drop occurring between 14JAN at 0200 and 14JAN at 1300. You see the price rallied to a consolidation then drops QUICKLY or with heavy momentum. This is evidence of a level with a big imbalance of sellers compared to buyers. Also, and I think more importantly, look back at the history of this level (wmd @ ff, Seiden). You will see that price used it relatively recently as support then went right through it on 12JAN. …used it again this time as resistance/supply on the 14th(my nice little supply level, remember). Evidence is stacking up. So, I know there is a high probability price will bounce back off of that level again with extremme prejudice.
-
Entry Options:
Option A shown on the third chart:
I place my sell limit order right below the 91.85 level in order to get it in before everyone else who’s thinking the same thing as me. LoL! My stop is right above the high side of the supply level at about 4 pips.
Option B:
I learned earlier today there is a way to have the metatrader send you a text message to your phone when price reaches a certain level. I can program it to notify me when price is in the supply zone and I can get into my den and examine price action at that area and determine my entry from there based on fibs, trend lines or maybe even an oscillater or indicator. (mastergunner99) -
Exit
(Seiden, “look to the left”)Take profit is at 3 x’s the distance between my limit order and my stop loss (approximated). I usually aim for 2X’s the stop/entry difference but if 3x’s is available for potential profits I’ll take it. See my previous posts in this thread to see how I determine that. It’s very simple!
I’m going to keep you all updated on this. Hell, I’m interested in how it will turns out. 
Good trading, stay emotionless, but keep smiling.
David
Here we go:
gbpuusd 4hr. predetermined supply level from yesterday. former resistance/turned supply… after bear candle formed at 0400 on 20Jan ran a fib. I got confluence of pinbar at demand + 38.2%. Placed buy order as soon as bar closed at 0800. Up 40 pips right now. sl originally just south of demand level. tp profit at 3x’s entry - orignal sl = about 60 pips. moved stop north of buy entry. free trade to 60 pips from here.
bearish candle bit me and stopped out at +42 pips.
Good trade.
See the quote below for reference. I went with option A placing a sell limit below the supply level and a stop just above it. The order was placed at 1136gmt. I’ll check on it at lunch EST or update you if it fails or stops out. Have a great trading day, gang.
MG, did you hang in there long enough for the big drop? Still going on as I type this.
Hopefully, although the climb up would have been a bit harrowing.
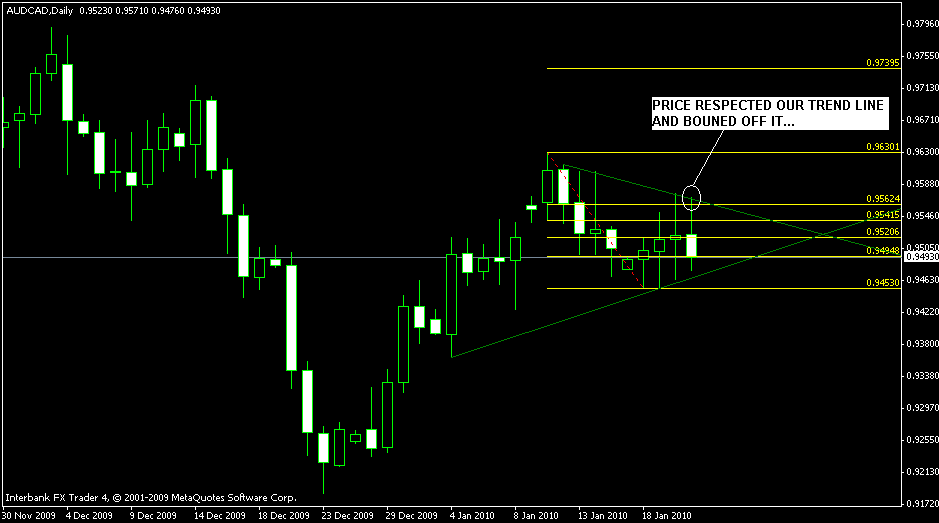
Price is still respecting the upper trend line that we drew yesterday and is riding down. Good news !
I hope it gives way for the rock to drop and enable mastergunner to gain. Lets wait for his updation.
Regards,
Muthu.
Chennai.
India.
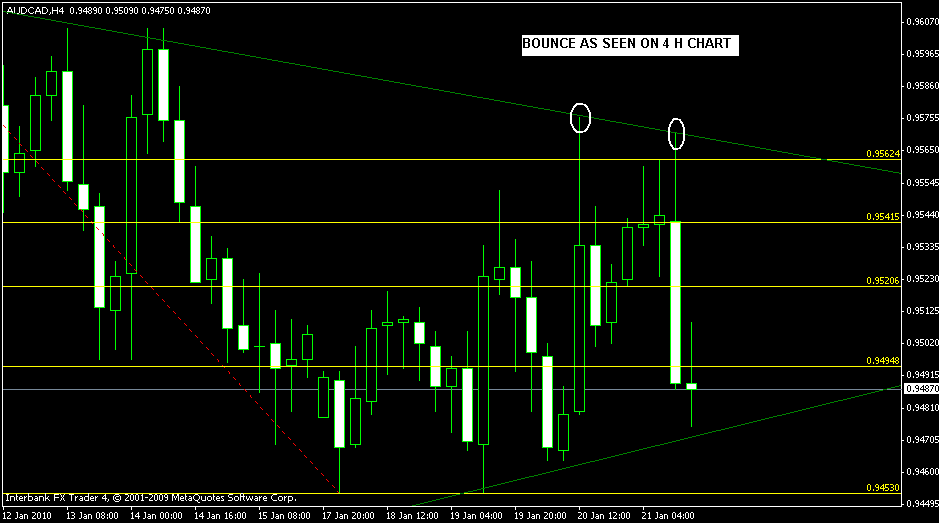
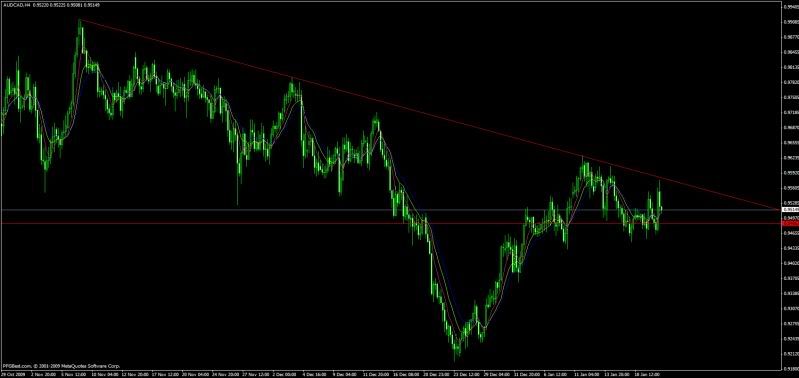
Zooming further, This is how our AUD CAD 4H chart looked, with the trendline bounce happening twice.
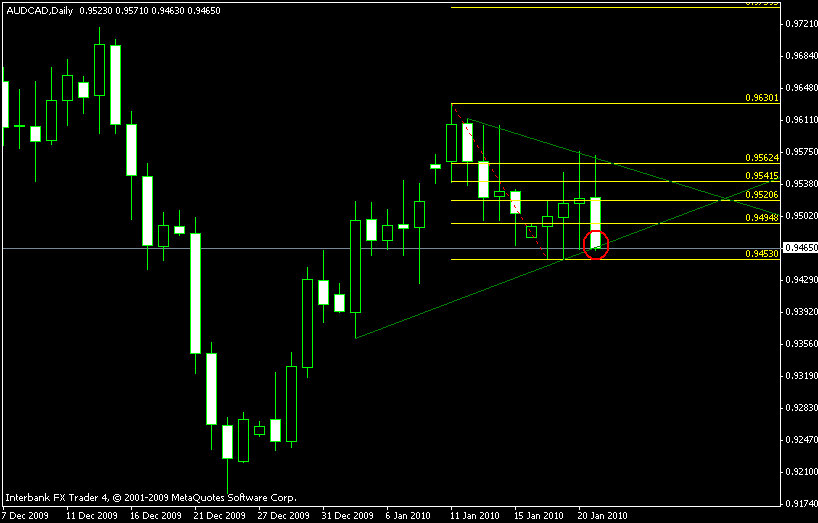
Price Action has reached our lower trend line now on Aud Cad. With Aussie open not far away, will it be a bounce or a break ? Lets see. I hope mastergunner made pips out of this trade.
Regards,
Muthu.
Yeah, I’m still in the trade. Sitting around break even now.
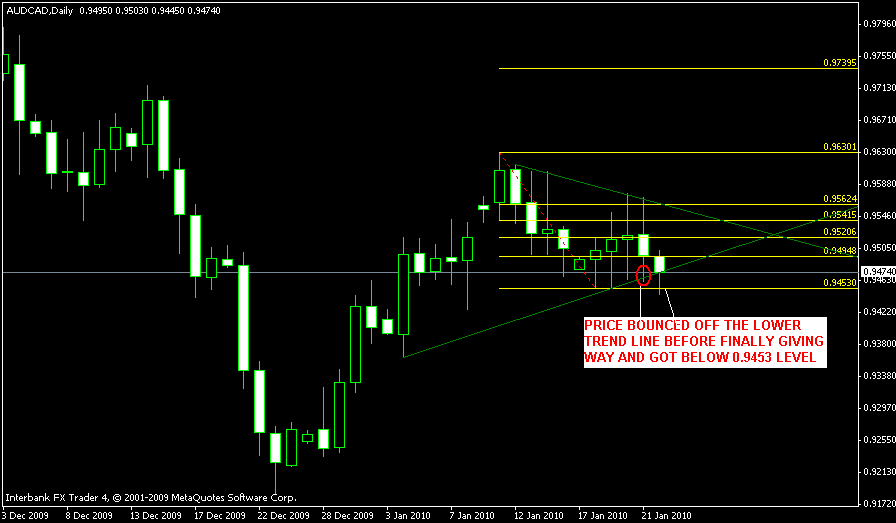
Good to know and i hope this final push gave you profits. Price did bounce off the lower trendline as well before finally getting thru it and breaking the mini support shown by the lower fib level. Hope you booked your profits.
Regards,
Muthu.
As I develop my own method there will be lessons learned. Here’s one for sure. Here’s the USDCAD 1H. I have a decent supply level plotted and I am ready to sell.
This is what I did. In the first pic (blue trend lines on chart and oscillator) I posted an RSI to get some confirmation. I “thought” I had regular bearish divergence, so I went in. The trend continued to go up and stopped me out.
I through out the red coaches flag because I disagreed with the call. The referees went to the replay booth and announced bad news: “Upon further review the call on the field stands. Gravitas is charged with a time out.” This is what happened. Look at the pic with the red trend lines on the rsi and chart. There is a double bottom prior to the move to my supply level with hidden bullish divergence.
How do I look out for this in the future?
- I propose I should not only look for one type of divergence, but to look for another.
- I should only be looking for divergence at double tops and double bottoms.
If anyone else can lend a critique I sure would like to hear from you.
That was a strong momentum move up in the first place, and on the 4 hour chart, there was a fairly apparent bullish flag prior to your engagement.
That alone would have given me second thoughts on a short position.
You probably called the right move, just a bit too early. Fine line there.
Ahaaaa! I see now… another reason the RSI showed hidden bullish divergence. That’s still no excuse for me to have ignored the price action. Thank you.
FYI… I had exited the Audcad trade for a minimal loss. I decided to look at it again as if it was not in the market. To me price looked indecisive and I would not otherwise enter into the market when there is such uncertainty.
Let me post this real quick like. I have an order in to sell the gu. Nice little supply level, saw the bear candle form and ran a fibo. Also notice the trend from the high on 19jan through the 23.6% level. Got the order in to go short at the 23.6% which coincides with the trend line break. SL at .62440. tp at 6131. I’m letting it run.
good trading everyone!
Moved the stop loss to break even after 20 pips and it bit me for a one pip loss. No biggy.
READY AND FORWARD!


 take profit right at 60 pips.
