I don’t have any track record like myfxbook etc. The ways I trade are usually simple enough that people can easily backtest and in fact, I encourage people to backtest first so they can get comfortable with the strategy rather than looking at numbers and then beleiving it and putting their money in.
Also I have nothing to proof, not selling a course or anything. Just here to share my knowledge and people can take it or leave it
Feel free to have a read though and let me know if you have any specific questions. Then I can provide diagram/trade setups accordingly to help you understand better.
If you are following this strategy, often I like to only have minimum SL to ensure nice RR ratio. Usually at the open price or at the highest/lowest price of the previous candle depending on the situation. Doing some backtesting will help gaining experience with this.
Hello Cloudninee,
Do you have a high win rate with this method because of looking for the 1;1 rr for the 80%? Or do you get enough runs with the further 20% to make up for losses?
Cheers John
Hi, thanks for sharing your strategy! I wonder what does other pairs are but somehow I can’t sent you a message. Is this because I have just registered here?
As you can see in my chart examples, my SL is very tight so the 1:1 RR is very achievable again and again. Once my 1:1 is achieved, my 20% runner will have a BE SL and I let it ride. As I trade with the market’s momentum on the daily chart, most of the time if my analysis is correct and if I only trade strong signals, the market will move in my direction for at least the following day. That’s the key though, only trade strong signals and you will come out on top.
The 20% trade plays a big part too when there is a strong trend, as you can really ride a trend out. Check out gold on its recent ride up, my trade stayed open for that for nearly a month (June to July)
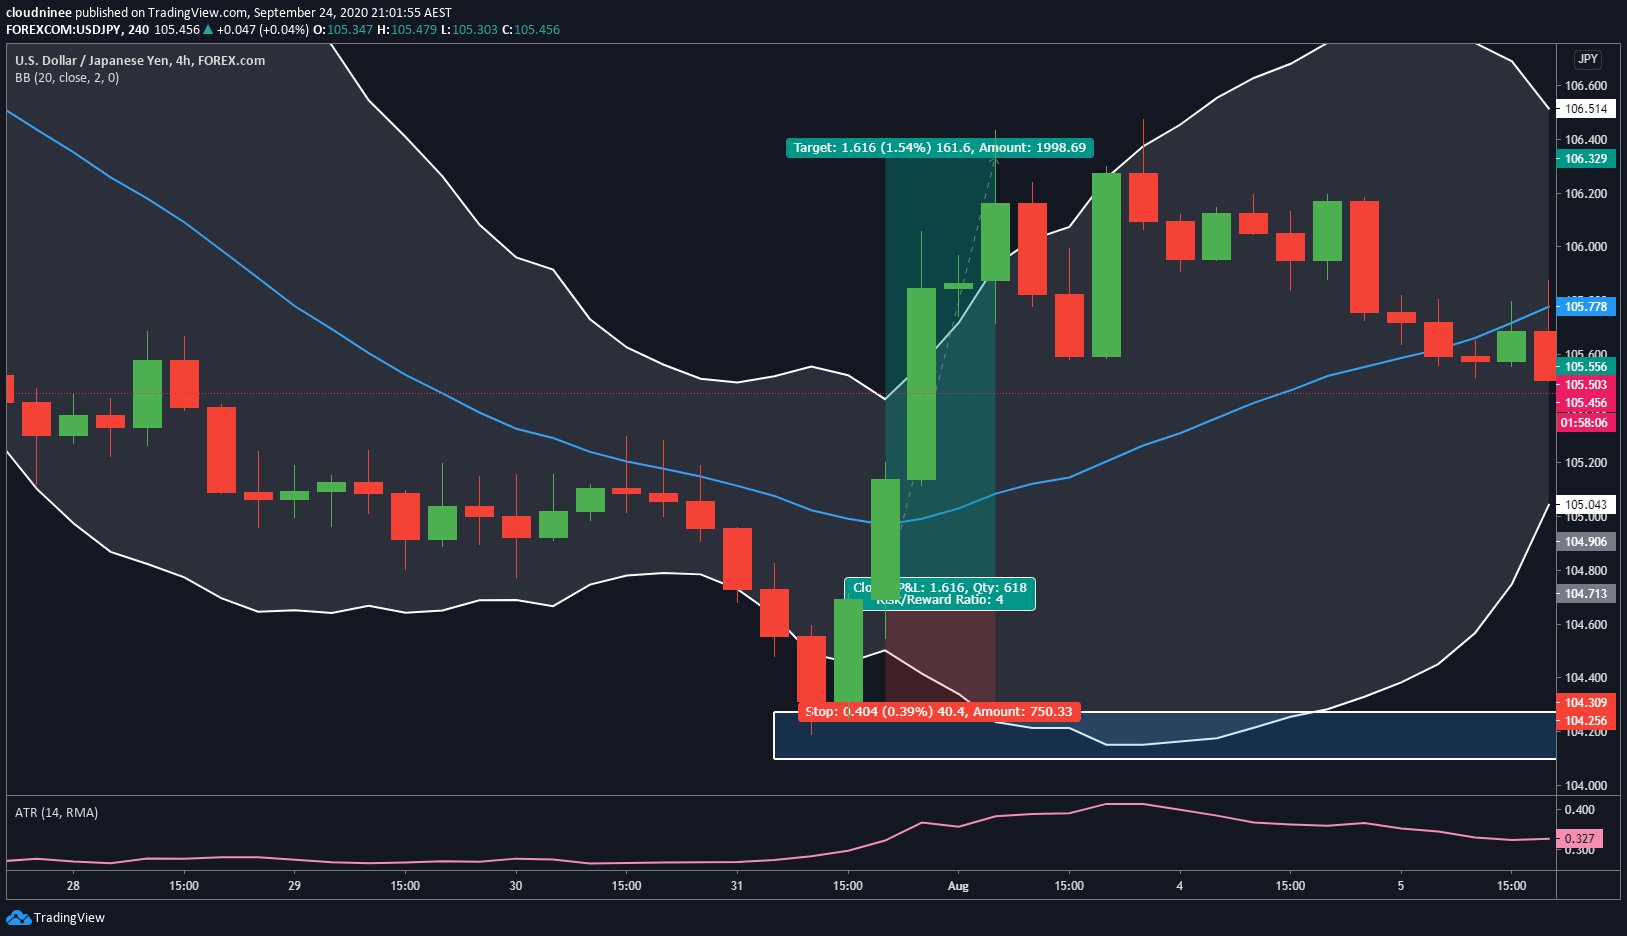
When there is a very strong signal, I can go for more than 1:1 RR. I have attached one of the examples below. This trade could have easily been a 4:1 or 3:1 depending on how you manage your trade, very subjective as each trader is different - a beginner would get very twitchy and move his/her SL every hour while an experienced trader would be more patient and only move SL up tight at signs of reversal or consolidation. The signal is very strong - multiple signs of exhaustion in the bears market, break out of the low of the bollinger bands, bullish engulfing with little wicks to the upside, etc.
What you can also do is move your SL up on the way on a strong trend like this and one tip I can give with that, and you only need to do it if you have time, is use the 4H timeframe. Then you can move your SL up to the most recent swing high/low.
Hope this helps and anything else, just let me know
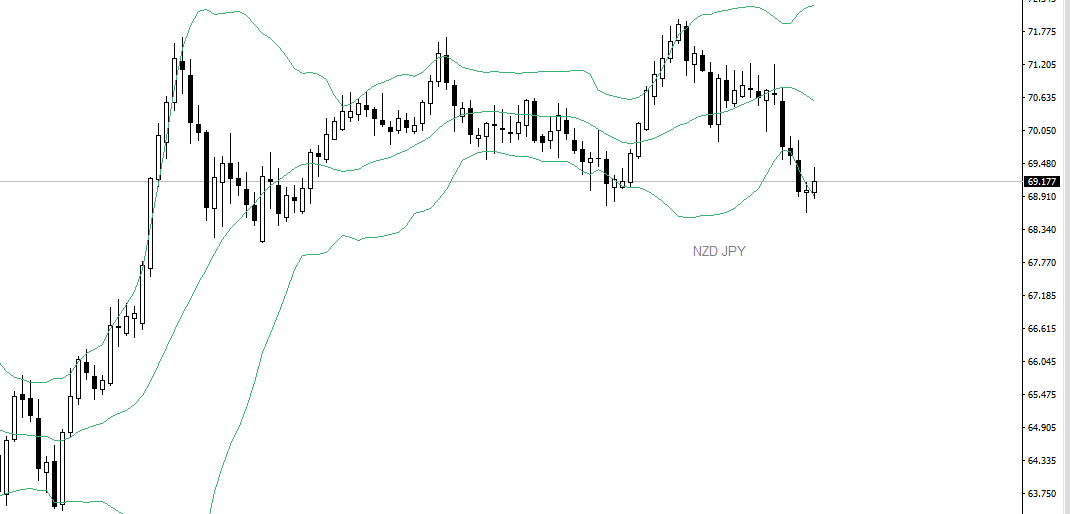
I got something interesting @ D1 NZD/JPY (NZD/USD looks almost the same)
Still some hours until the candle closes, but imagine that this white candle would be a little bit longer at the end of the Day, would you call this a good opportunity?
If the Candle would close like this, would you call the wick to long?
Good spotting, this is a mixed situation and I’ll tell you why below.
It does look like a good opportunity for a few reasons:
Price has bounced off the most recent support (look left) and it appears that same place has been resistance before as well
A doji candle has formed the previous day and today’s candle has been bullish
HOWEVER, I would also be very cautious about taking a trade here because:
The overall recent trend is down, and it has been very bearish for 2+ weeks with many signs of rejection for the bulls, or in another word, the bears have been in control for quite a while with the bulls having little place in the market
This is only the first sign of reversal and the signal candle (current candle) is not as bullish as I’d personally want it to be to take the trade (long upper wick of the current candle showing bearish power)
If you want to take this trade, my advice to you would be to:
Place a BUY STOP at the high of the signal candle to ensure the market will go in your direction to take your position with momentum
Monitor your trade closely (maybe use the 4H or 1H timeframe to move your SL as you go to secure profits on the go as it can easily turn around and keep going with the trend at any time
Only aim at maximum for price to reach back at the middle of the bollinger bands (price won’t go to the other end unless the trend has changed
Placing a buy stop sounds like a good idea in situation like that, because as you said, the current candle is not a bullish as it should be.
I was also considering this candle for not bullish enough, but I didn’t think about the buy stop.
Right now the candle looks even less bullish, looks like it is forming a hammer, which could also be a signal for a trend reversal but further confirmation is required.
A hammer candle following a doji shows market indecision. When there are these signals you need another candle to confirm the direction. Long wicks indicate the power of the opposite side stepping in so to be cautious
You can clearly see though how the daily candle/chart can really help you put things into perspective because it takes 24 hours to form. The one candle alone contains a hell lot of information that can help you make decisions with ample time. If you look at a doji candle on the daily chart comparing to the 1m chart, which do you think would be more helpful and trustworthy? Which would give you a better picture? And most improtant of all, which would give you more TIME to decide on a trade?
It is and I am taking it. BUY STOP order at the high of that bullish candle.
Although I am going to say it is a risky one because:
We are trading against the trend here. It has been VERY bearish for days
The previous candle (to the bullish one) isn’t exactly showing market losing momentum to the downside, in fact, it shows the market tried to go higher but failed and the bears took it down
But, yesterday’s candle is such a strong bullish signal that I cannot ignore. Perhaps it could be a pullback/price correction and it has the potential to go back up at least for a day or two. Only going for a 1:1 RR for now and have my runner going to be safe. Short trade this is going to be and at the first sign of continuation to the downside I’m out.