The goal of this thread is to show traders a more consistent, reliable way of trading the Currency Market using Price Action on the Daily & 4 Hour Charts. You will see a more practical, realistic way of trading that is in sync with the major market movements, independent of;
[ul]
[li]Lagging Statistical Indicators;
[/li][li]Contradictory Economic News;
[/li][li]Volatile, Stressful Lower Time Frames;
[/li][/ul]
INDICATORS & ECONOMIC DATA
Statistical Indicators are the most widely used tools in trading, but most are based on past price data. This makes them lagging in nature and inaccurate when providing entry signals. Short-term economic data are also used to support technical-based trading, but most are often quite volatile and lead to erratic, short-lived reactions. Since the major economic factors that actually lead to strong currency movements will be reflected on the Larger Time Frames, using these signals for market direction will always be the better decision for traders.
HIGH FAILURE RATE OF TRADERS
The reality of Forex Trading is the vast majority of persons lose money. Since most tend to be Day Traders, using the smaller time frames for their trading, the high failure rate is at least highly correlated with this way of trading, if not the cause of it.
Most persons that were exposed to the market for the first time are likely to have headed straight for the smaller time frames in an attempt to capture small, but quick pips. This is what the Trading, Marketing and Brokerage Companies promote since the more frequently their clients trade, the more money there is for them, regardless of how profitable Day Trading actually is. If we were in charge of these companies, wouldn’t we do the same?
This isn’t to say that there aren’t successful Day traders, but there are several bad habits that are forced upon them by the volatile nature of the Smaller Time frames and daily currency movements that makes it highly unlikely:
• Indecision about the size of stop losses and pip targets;
• Constantly switching from currency to currency to decide on which to trade in the very short trading day;
• Anxiously waiting on a target to be hit;
• Indecision as to whether to monitor a trade or leave it until it is closed;
• The pressure to meet daily or weekly pip targets/monetary goals;
• Resisting or falling to the temptation of violating a trade plan in order to meet these targets;
• Trying to stay objective while wanting to take ´revenge´ on the market for a loss ;
• Getting more emotional, irritable and anxious than you normally are;
• Feeling trapped like a mouse in a maze, with the cheese nowhere to be found;
Another reason relates to the promoted approach to Currency Trading that comes from the prevalent culture in today’s society;
• Everything must be done NOW OR ELSE! Am I right?
Trading is just a click away and with the ability to see several pips of movement happening right in front of us everyday, it is very tempting to want to trade when we want to. But desire is one thing and reality is another.
Feeding our emotions on a regular basis when it comes to money is a recipe for disaster; using Discipline, Patience and Self-control along with High Probability, Stable Trades are the pillars for financial success over the LONG-TERM.
This is what the Swing Trading on the Larger Time Frames offers. You can identify a setup, trade it, then leave it until the target is hit a few days later. No need to micro manage your trade. I you were to just take a cursory glance at these time frames relative to the smaller charts you can see the greater stability and consistency in their movements.
When this is combined with my Price Action strategy, which identifies high probability candlestick patterns without the use of lagging Statistical Indicators, trading becomes a lot simpler. There is also no need to follow the news since most of it is volatile and contradictory and are usually reflected in the signals given on the larger time frames.
FROM DAY TRADING TO SWING TRADING
I used to Day Trade and failed at miserably, no matter how often I tried different approaches. It was only after several years of losing money that I actually started to look at the higher time frames and started to be profitable. Unfortunately it took me a while to humble myself and ignore the lower time frames for good. Having finally done this, I spent several months developing a Trading Manual that narrows down the parameters needed to successfully trade the larger trends. This was done to both serve as clear and strong guide for myself as well as to share with others who are also tired of the futility of Day Trading.
The advantages of this approach to trading generally and my method of trading specifically, include;
• High Probability Trade Setups that Require Less Trading;
• Predictable times for entry using the Daily and 4 Hour Charts;
• Clear Candlestick Patterns that start and end Trends;
• 100- 200 Pip Trades such as those executed during the Financial Crisis and European Debt Crisis and that have already beaten the BarclayHedge Top 10 Traders this year;
• Practical, Unemotional ways to avoid checking trades;
• Pre-determined exit rules based on each trade setup;
• Weekly & Monthly Ranges not seen in any other strategy;
• A Proven set of parameters built on 10 years of trading and analysis of market patterns;
Let´s take these two examples that reflect the greater stress and indecision that a Day Trader goes through compared to that for a Swing Trader.
In the first case, the Day Trader would be faced with the indecision about where to exit and how many pips to capture following an interest rate decision by the Reserve Bank of New Zealand earlier this year-
NZD CAD - 30 MINUTE CHART

For the Swing Trader on the other hand, he would simply have identified the setup and signal and waited on the Pre-determined target to be hit a few days later - independent of the rate decision.
NZD CAD - DAILY CHART

Even during the European Sovereign Debt Crisis when volatility and market indecision was at its peak, several opportunities were available without the need for complicated indicators and lower time frame analysis;
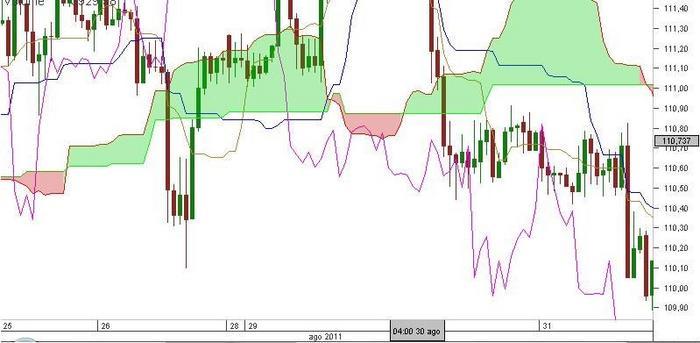
EURO JPY - 1 HOUR CHART
EURO JPY - DAILY CHART

Sometimes I got lucky, as in this case, the 200 Pip Target was hit the next day, well within my pre-determined holding period. This took place while I was watching an all day Marathon of my favourite TV series at the time, Bones, instead of constantly analyzing the trade.
In a nutshell, it is a strategy that Rewards the Trader instead of the broker by avoiding the Stop-Hunting and unexpected reversals that take place on the Smaller Time Frames.
If you follow my Swing Trades and my regular market analysis, you will see a consistent and stable way of trading for Long-Run Wealth Creation.
When you are convinced, send me a private message for more information on my Methodology.
Regards
DRFXTrading


