Wondering if anyone else has been catching some of these great moves in the EURUSD, GBPUSD, AND AUDUSD? I have been cashing in.
Hi, I was wondering if anyone of you would be interested in starting a price action trading network.
If you are a fan of Nail Fuller and have his course, its difficult to talk with other trader because the forum is highly moderated.
I’m a live trader and have been looking to network with other price action traders so we could
share trades, keep each other accountable, etc… Let me know if you are interested. Please write on my wall.
You can do that in this thread! I’m also a follower of Nial’s, I like that his forum is moderated, keeps it clean!
Hey there, fantastic idea, I’ve just joined here on babypips and its good to meet some other Nial groupies 
I’ve had some real success combining what I’ve learn’t from Nial and the material in the school of pipsology. I really feel I’m on the cusp of becoming very successful, the only thing I struggle with is keeping a good journal. I’d love to hear how other ‘Fullerettes’ go about logging their trades.
Have you checked out the trading journal template that Nial provides? You can get it here: forex trading journal
It’s not exactly ‘perfect’ for everyone, and you may have to tweak it a bit to meet your specifications, but it is a good free resource for getting started in tracking your trades.
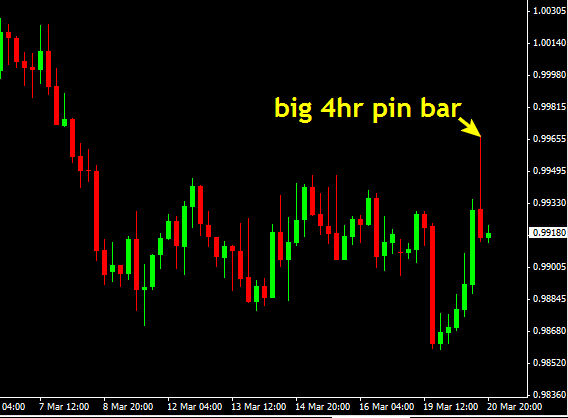
Here’s a cool 4hr pin bar that formed on the USDCAD today, I think this market is about to tank personally…
Looks like it. Stops to big for me but I always wait for price to hit 50% of that wick and I would be in. However I hope not the case so my aussie short stays heading down
I just found this thread. Looks like it died for a while, hopefully these recent posts continue. I think it’s a great idea. Sharing price action set ups and advice.
Nail’s strategy seems to have a lot in common with Steve Nison, who says he’s the one who brought Japanese candlesticks to the west. Anyone who wants to learn about candlesticks, I suggest checking him out also.
mindsetpips, you’ve been posting screen shots and trades. It’s great. Keep it up. And others should too. Is the original poster trader2000 still here?
I plan on starting to do serious practice and journaling next week, so I’ll try to post a screen shots of trades here in the future.
Just wondering about the criteria of this set up… From my understanding, when using a pin bar as a reversal signal, it’s best if it occurs during a trend. The market looks to be in more of a range than a downtrend here. Or would you say the previous bear candle is enough of a trend for the following pin bar to be meaningful?
Here’s a trade I’m in right now. I’m gonna post multiple time frames. I’ll post results as it unfolds. Feedback/suggestion welcome and encouraged.
USD/JPY
Signal: Symmetrical Triangle forming on uptrend
Entrance: at upward breakout of triangle
SL: opposite side of formation
Target: near previous resistance from a year ago, adjust lower in case of reversal
USD/JPY 4 Hourly (above)
Consolidating triangle forming in an uptrend.
Looking for a breakout of the triangle upwards, to resume the trend.
Not sure if i would have entered on a lower breakout, as trend is up. Might have done it just for experiment.
Indigo line at top is resistance from about a year ago.
USD/JPY Daily (above)
Zooming out to 1 Day to see the trend is up.
No resistance in sight
USD/JPY Monthly (above)
Zooming out to Monthly chart to find resistance from about a year ago. Not sure how significant that resistance would be, as it’s ancient. Keeping an eye on it.
By the way, the yellow circle on the month chart contains both the above 4 hour and daily charts. That pink vertical line is the two triangle lines, MT4 thinks they should be vertical when you zoom out to the monthly chart.
After a while, this is what the trade looks like (below). A bit concerned about the level of the top left of the triangle shape acting as resistance. Baby Pips School seems to ignore that in their triangle lessons, so hoping price will ignore it as well.
USD/JPY 4 Hourly (above)
SL: red line
Entry: orange line
Possible resistance that I don’t like: pink line
TP: green line
Previous high from 1 year ago: Indigo line
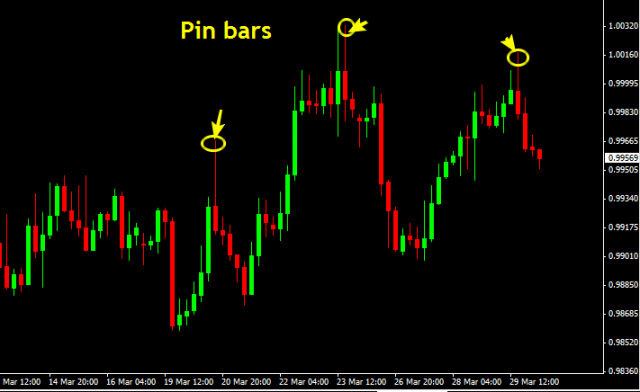
Looks like that pin I marked last time could have at least allowed you to get to breakeven…I didn’t trade it, there have since been some other pins on this 4hr USDCAD chart as well as the daily chart.
Yea, I learned from Steve Nison’s books in the early going. I think looking back what he teaches is good to build a price action foundation from, but he doesn’t really teach a specific trading strategy like Nial does. I honestly felt a little lost after reading Nison’s stuff, even though I knew what he was teaching was sound. When I found Nial’s PA strategies I really began to understand how to develop a strategy out of PA rather than just learning the individual bars…
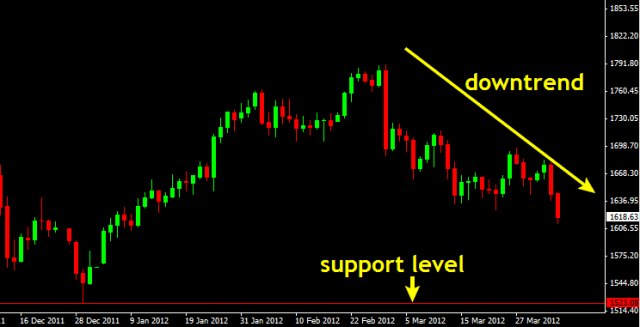
the gold market is in a downtrend clearly. I personally think price is going to hit $1523.00 again before this downtrend has a chance at ending.

The real question is where do you get in and what are you risking?
Mind u, its in a strong support area at the moment.
Shorting off the Daily chart now is very risky.
So back to the same question. Where to short and what is the risk like?
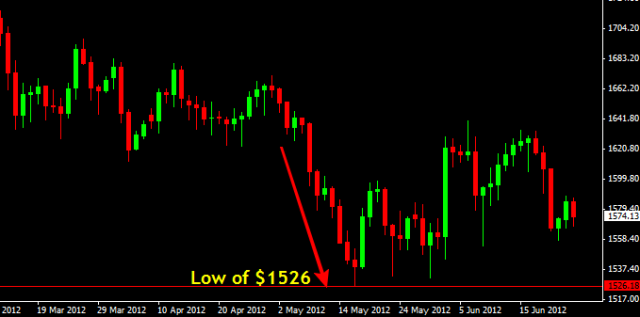
I have not been on this thread for a while. My apologies. I just noticed that in my last post I said I thought gold was going to $1523.00, it went to $1526.00 approximately…not a bad call, only off by $3 an ounce! We were all discussing gold a lot recently in the learn to trade the market forum, so I was pretty fixated on it for a while. It’s pretty cool how sort of just “specializing” in a certain like that will really get you in-tune with it’s price action.
Hi Guys I wont go into any long introductions or who and where I have been learning PA from, nor which sites are the best etc as I don’t know about that side of things and it seems to have been done to death on this thread anyhow.
I would welcome any comments on the Minor Fakey setup on the EUR/JPY. I have attached a daily chart (in line with the trend and also a rejection of the 55% fib level from the previous down move.) However the Weekly chart does look rather bearish. It might be worth mentioning that there was a golden cross previously to the recent up move so that might serve to add some weight to the set up and the risk reward looks pretty good too with no immediate overhead resistance should the setup been completed.
This seems like a great place to discuss these approaches and I am pleased that others seem to be benefiting from these PA opportunities!
Any comments would be most welcome. I have traded the three basic set ups that you have been using and I am having the best results over a 2 month period that I have ever had.
Take care out there!
Best regards
Here is a set up style that I have been looking at recently. (Demo only at this stage) It involves the inside bar and standard bollinger bands. (20 period 2std dev These are only used in the same way as other confluent approaches)
Set up is really basic enter at the break of the inside bar against the upper or lower band. If the inside trigger candle is broken in a continuation of the ccurrent direction then all bets are off. Risk reward is currently at 1:1-1:1.5 (Not ideal obviously) however the hit rate seems quite favourable.
I have ringed 5 trades that could have been taken over the last 3 weeks. 4 of these would have resulted in wins and one (the bottom right) would have washed you out. This exercise was carried out on a 4hr timeframe or above. It is interesting to note that this approach works well on some pairs and instruments and not so well on others.
I will post some of these set ups as they happen with the results, if people are curious enough to want to know what happens.
There has been a false break of the mother candle, but I am going to leave this set up alone now. The stop would now go below the break candle and entry moved to a break of the mother candle. There is not enough room for a 2:1 Risk ratio if the 101.24 resistance level is considered. (This is the area that I have it on my chart!)


