forget about the line and concentrate on the candle patterns Tom82
Oh, yes I did forget to check the economic calendar. Usually I look it up.
Do you usually trade Mondays?
Do you trade only in the direction of the bias or do you trade in both directions?
Thanks very much! 
Im very careful and extra patient on a Monday and Fridays.
NFP days are also another day that I try not to trade.
I dont trade against Bias.
It makes me very jittery on retracements.
Makes sense, can be volitile.
If today was a buy, we would only look for longs off retracements and reversal candles etc?
hi nikita,
as you said we can actually see if there’s an opportunity to short or long based on HH or LL in the 1H chart. i’m thinking that in monday or in a striped week like last week, we might define the day bias based on the 4H chart. for example after 2 candles in 4H (one market session) we might know if that day is a buy or sell. then we check the 1H see if the price is actually making HH or LL to confirm the day bias. if in 1H price is ranging then better keep out because there is no bias for that day.
Alot of traders here seem to be reading H4 charts.
I am looking at them but at the moment I have not got the hang of it yet.
I dont know what is it that they see in the H4 chart that helps them pick trades.
If I do find something Ill update the thread.
EU H1
Two entries given for the day on H1. First one was for a sell, SL was about 30 plus pips. Second was for a buy. SL was again about 30 pips.
If we had gone for the sell without bias confirmation then we would have had a loosing trade today. That happens to everyone who trades. Bad calls that hit SL. What would have been worst had we taken the sell is the chance of missing the buy entry also.
EU H1
Both the blue lines are SL and TP for a sell as per wave.
Green lines are SL and TP for buy as per wave.
The yellow line in the middle would have been the entry for either buy or sell. Note that we would wait for the price pull back candle to be over before waiting for entry on the new hour.
EU Min 15.
Just as an idea how things look on a smaller TF.
Hope H1 charts like the above gives an idea to those who are trying this out and are having difficulties reading bias.
I think bias is the ebb and flow.
Like the tide at the beach. Flowing from one side to the other and back.
Comments, thoughts?
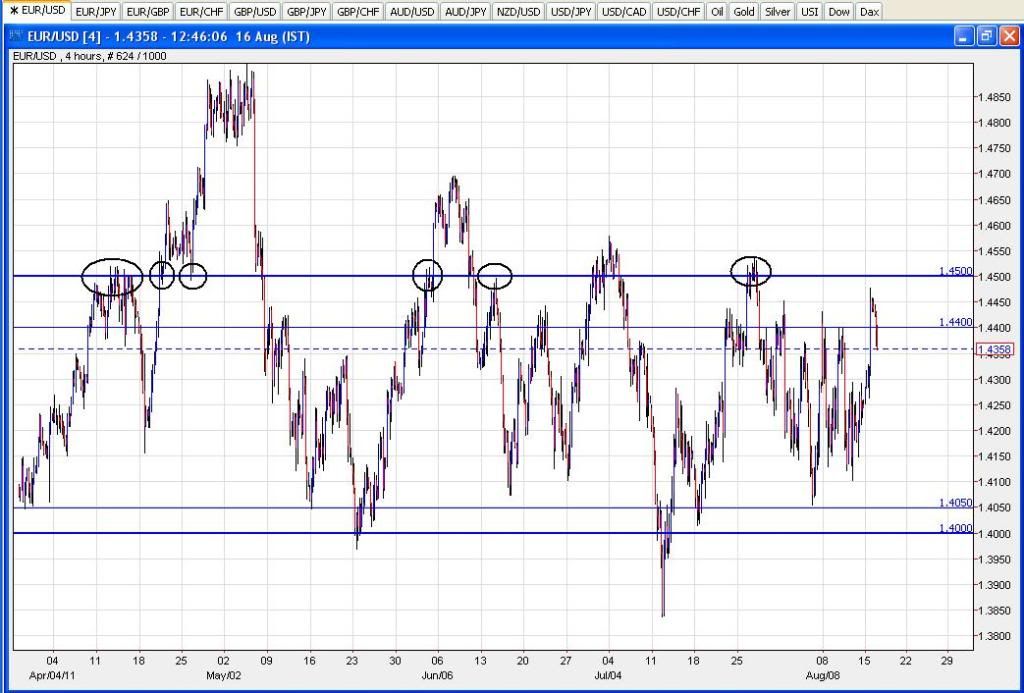
If you scroll out on your 4H chart you can see historical zones where price reacted strongly to particular levels. Chances are price will react strongly to these levels again in the future so you can draw horizontal lines on your charts to highlight these zones of interest to traders. Once price hits those levels again you can use an appropriate trigger on the lower timeframes to get into a lower risk trade. You can use the Daily the same as the 4H for these horizontal S&R lines but I prefer the 4H myself as it gives a flavour of what happened throughout the day. So with E/U it’s clear that 1.45-1.4550 has been a zone where price has reacted strongly in the past 5 months - chances are if it gets up around there again it’ll provide some good trade opportunities.
so… we draw the zone in 1D and 4H, and apply them on 1H? is it like that?
i used to to this… but then my charts was full of lines. so how do we determine which line is valid?
You can keep your charts relatively uncluttered - I’ve only got the big obvious areas on my 4H chart. And I usually only keep a couple of upper bands and a couple of lower bands. If price moves into a new area I’ll then remove the un-needed ones. Then I’ll keep an eye also on previous / current daily / weekly / monthly high & low as well as previous session high & low. Price action and your entry triggers will tell you what’s valid - if you see spinning tops, dojis, etc. developing on the lower timeframes at levels you’ve highlighted during a pullback in a downtrend then you’ve potentially got yourself a lower risk short entry to hop into the downtrend again.
GU H1 TF
GU D TF
Time to cut and run.
The yellow was the TP.
Hanging on the 40 plus range and the other pairs dont seem healthy.
( P/S TP hit at 10.30 ish PM GMT + 8. 60 pips done for the day. Only a single trade. )
Personally I draw on any lines that occur to me as I go over the chart, then when I am done sit back and take a look at it. If there are so many lines that it clouds my understanding of the chart, then I just remove some, keeping the lines with the most touches. I also favour lines that have acted as both Support and Resistance. There really should not be that many lines, but if there are just go with the ones that have the most touches. Unless you are talking all-time highs or lows, anything with only one or two touches doesn’t mean much. Also bear in mind that touches do not have to be right on the line - stopping a few pips shy, or sneaking a few pips over, can still represent a reaction to the same overall Price territory. I think of Support and Resistance as zones rather than lines.
ST
Rejection and Support areas.
Pure price action again.
EU H4
EU H1
Again note the pull back candles on both TF.
Bias is taken to be the previous rejection at the same areas.
SL is at the peak of the wave as usual. SL was about 20 pips.
Trade would have been +90 at the moment.
Correct me if I am missing anything else.
Thanks.
As a continuation of post 254,
EU H1
This is happening as of 1232 GMT +8.
Observe the SL at the peak of the previous candle, which is marked by the blue line.
I admit I was not watching as I was busy on FB. A short in that area would have had a SL of less then 10 pips.
Now watch the current candle. Mind you candle has not ended so it could end up any which way.
But looking at it as it is now, it looks like a signal to short.
I might or I might wait for a new H4 candle before deciding on anything.
But just wanted to share on how beautifully the set up had worked out as PipBandit pointed out.
Should have had the presence of mind to put in a pending order around that level.
Would the ZigZag indicator in MT4 be helpful?
It draws a line from LL to HH to LL etc.
Just another thought.
a noob learning from someone like this actually need a unwavering faith. i know because i am a noob and i’m learning. i thought i need to patch the system here and there. no… i’m a noob all i can do is to have a working system and discipline myself to it. i add this and that before i knew it, i’m no longer naked.
this is like learning kung fu. if you don’t trust your shifu, you’re not learning.
one day when you’ve become a kung fu master, then you may learn other styles. adjust it here and there. might as well develop your own style and open your own kung fu school.
hahah tried that one long time ago…wait till it starts jumping as the LL that was just formed on the last candle is broken and another LL is formed. It just shifts itself and forgets about what it just did an hour ago.
That indicator is something people like TRO or Avery Thornton would be proud of.
What happened karate kid ??
Hi Nikita, greetings to all.
Yes I’m still reading and trying to learn! although I’m paper trading for now after losing £600 last week trying to short usd/chf skyrocket! (I’m sure I can here giggling).
I set out this week with renewed thoughts, watched Monday’s EU and GU. Managed to get the GU trade you had on Tuesday (virtual trade) and thought I was actually learning something, how wrong can you be?
Yesterday I set out my screen with EU and GU, placed trend lines beneath the higher lows to prove up days, thinking if price marches across this line waves going back into the sea and down day begins. As the morning progressed (UK time) I noticed both charts Highs were getting lower so I put lines on top to see a nice triangle forming. Now I’m thinking bias is turning, time to short! GU took a nose dive to about 1.6400 and then BOING…down went a bungee jumper! now this means EU will follow (ho ho ho). I watched EU as price went up and then retreated as expected and beginning to form a dodgy thingy, looks like a short coming my way.
I placed my virtual sell (changed to M15 to see a nice dodgy) and sat back smoking my virtual cigar only to find both GU and EU shoot to the skies wiping out my theoretical profit.
I am writing this hoping you will tell me off with a lesson I must learn and hope others reading it will also learn from my mistake. What I think happened is a report was issued in the US which the big guys did not like and dumped the dollar (I feel a sense of de ja vue here).
What am I doing wrong? do I need a psychiatrist?