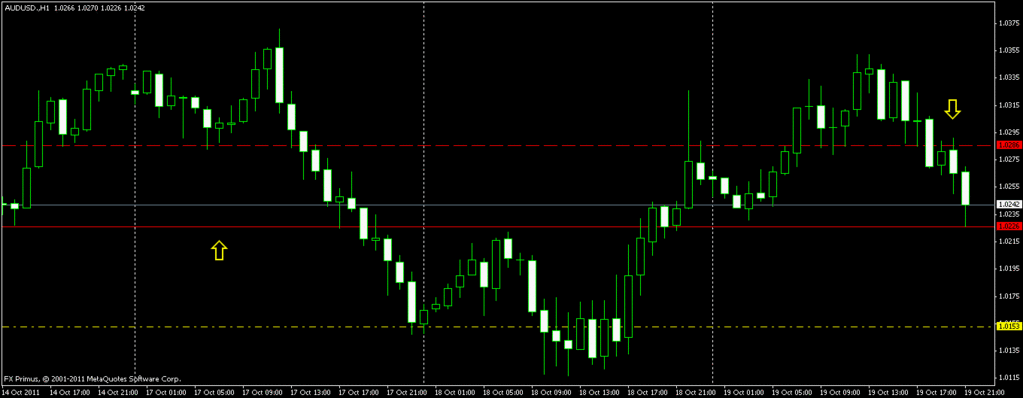
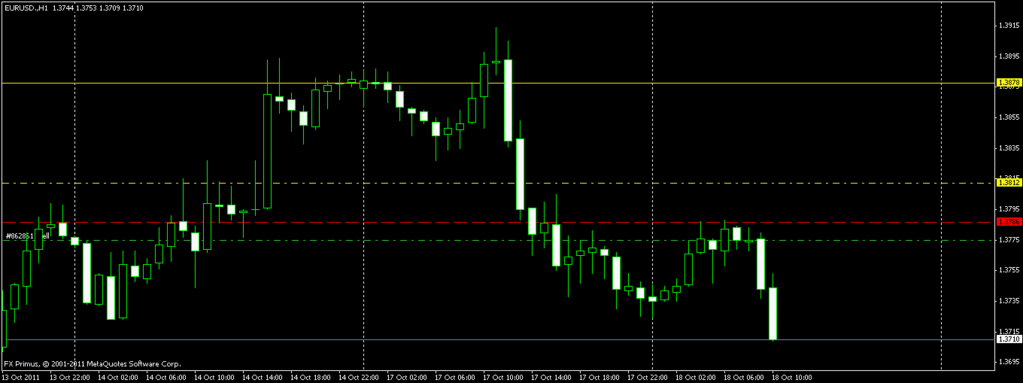
Pure Price Action For Dummies

I have enjoyed reading this thread, thank you. I agree with your principle of keeping it simple.

However, there are two kinds of SLs, one is the kind which can be set by a trader, which is optional, the other kind is the margin call, which is not optional, and there can be a big difference between them. With that big difference in mind, I believe in using SLs, but for a reason not yet mentioned here. For instance, like many other people, the electric, telephone and Internet lines in the area where I live are carried on tall poles by the roadsides. Unfortunately, those services can be interrupted by strong storms, lightning strikes, falling trees and automobile accidents, etc., which can suddenly and unexpectedly shut down computer communications. True, mobile phones are not affected, but let me focus on desktop computers. The point is that setting a SL, even a very wide SL, gives insurance that a margin call can be avoided, no matter what happens to computer communications. I love the technology, but occasionally things can and will go wrong with it, even if only rarely, and the good thing is that it costs nothing to set a SL in place, as insurance.

Anyway, back to Pure Price Action.

My report card after using Nikita’s method…AWESOME! Simply and unbelievably AWESOME! 2 key words that I have learnt reading his comments are Keep It Simple and Commie rule. Stick to this and you are almost there.

My first 2 days last week were bad, very bad(I am on demo account by the way). Post mortem on Wednesday(another loss day) and fine tuned my entry as that was my problem. Thursday and Friday avg’ed 30+ pips with no losses. Spent Saturday and Sunday looking at the charts and studying every candlestick(for the past month) from MN TF right down to Minute TF.

Saw some interesting repeating patterns. And this is key, it is always around the S&R areas. Well more than 90% of it is based off historical S&R levels. To get the best out of reversal patterns using candlesticks they must be around S&R levels. This allows you to get in at the LL or HH.

And this is key to my entry and exit points. Getting the bias and currency correllation is all nice and dandy but it is useless if you enter late or towards the end of a wave/rally.

Draw the S&R lines and it is as clear as daylight!

Case in point, based on bias and correlation today should be a buy and based on pass patterns the candlestick formation will dip first before rising. And it will rise at the Support level. I experimented by buying when I THOUGHT there was a reversal for AU at 1.0320 at 10 am GMT +8. Guess what, I was wrong. Why?

I FAILED TO BUY AT LL OR HH OR LH OR HL AT OR AROUND THE S&R LEVEL!

I then waited for it to hit at the support level I had plotted which was 1.0289 and…I bought with a SL of 16 pips and profitted 33 pips! The trade could have gone on for a nice 68+ pips and I contemplated putting a TP there. WHY?

It’s the next resistance level!

I can see the simplicity in this method and I love it. I am doing another experiment and this time I am short because there are 2 candles that have formed below the previous resistance. I should not have shorted it as there’s no entry candle to short but I am just doing it for the fun of experimenting and to see if the bias + S&R theory is correct.

By the way I can totally see the merit of not putting in a SL if you are consistently monitoring the screen and likewise a newbie like me SHOULD NEVER EVER do that. When I can hit Nikita’s level(hopefully latest by middle next year) I will be doing that as well.

Otherwise will report again later this week or early next week.

Thanks Nikita. :slight_smile:

Walking away without a SL caused me about 6 grands in one day this year. :stuck_out_tongue:

So becareful.

The saying that we buy low and sell high. What do they mean by it? Pay attention to this.

Finally, we wait for support to break and for it to be retested, we couple that with Bias and Correlation before going for a short.

Same with resistance. Break, retest as support, all others pointing north, we buy.

psylence, feel free to post your trading here.

Happy pipping.

Understood and point noted about SL. If and IF I were to ever contemplate not putting in SL it must be when I am at or near your level. At the current state I am in it is like 1% still got 99% to go. Anyway blowing 6 grand on one day may be big but if it is like a once in a blue moon occurrence and you mitigate that fact by having greater profits to cover it I believe isn’t too bad.

So, I did ended my earlier post by saying I was shorting a trade(AU) for experiment…guess what, 38 pips in the bag. So in one day I did a buy and sell and made almost 70 pips in both directions and in both trades I could have easily doubled it if I weren’t so conservative. All of it based on bias, currency correlation and most importantly S&R.

Exactly what Nikita mentioned!

I do not want to get carried away however this week is confirmation week. I.e. to confirm that this strategy works. The next couple of weeks all the way to late November is consistency and fine tuning. If all goes according to plan I’ll go live trading with micro lots first in late November, fingers crossed.

You’ve been awesome Nikita in helping out with your comments. :slight_smile:

Sorry can’t help it but thought I’d just share my thoughts.

All three USD pairs are ending bearish for the day it seems. Means tomorrow is a shorting day. To strengthen the view point that tomorrow is a bearish day, there is a Bearish Harami forming on AU and EU D TF as well as Bearish Engulfing on GBP D TF. Very strong signs of a continuation of a reversal. Need to look at bias and wait for some form of confirmation at S&R tomorrow to confirm this.

That’s all for tonight. Let’s see how it goes tomorrow.

EU D TF

EU H4 TF

EU H1 TF

Very classic price action.

H4 was a clear support broken and retested to be resistance.

Both AU and EU gave a very clear entry with a SL of about 15 pips or less today.

Happy Pipping.

Still not convinced that its not very difficult and dabbling with indicators?

U can use Indicators, if you are really good at reading price. Not the other way around.

Yup I saw that one. I actually entered AUD at the 2:00am GMT candle. Sadly I got taken out and had to go to bed. I’m feeling a bit sad that I missed another big move…

Did 2 trades on AU today both earning 30+ pips. Looking good so far.

At the moment I am sticking to a TP of 30-35 and am so tempted to go further. However I have a plan and will stick to it for now.

Right on psy. I had a short on AU last night but it didn’t swing down to my target. Came back up to my BE. Moved more than 100+ :frowning: no cake for me.

Can anybody give me a couple of names of what you believe are the top books regarding price action?

Nikita is the real expert, but she recommended postings from efxpa. I just received his free ebook on PA and think it is pretty good. There are plenty of on line video’s, see Eremarket, Sam Seiden, and the best educational resource on BP I have found aside from the BP school, is the thread from ICT with great videos and conversations. Hope this helps

Like all of us here, I am also but a student.

The biggest lesson I have been learning in the last three months is patience. Only enter when I know, now when I think I do.

I always wanted to go through ICTs thread but the sheer volume of it gives me a headache before I even start!.

I knew Efxpa has some nice clean charts and easy explanation.

The rule is to keep things simple and clear, adding on to it later as we go.

Always start with a demo, put in your TP, then refine it. You must be able to take atleast 10 trades without losses or holding beyond what your SL is before you should even think of using a live account. Dealing with real money while trying to learn somehow takes away the learning experience. But then that is just my opinion.

Have fun guys

DailyFX: Trading with Support and Resistance

This is what we are doing.

First off…awesome thread and thank you so much for sharing so much information.

My question: I can see what you’re doing…and really like it, but…how do you find such good set-ups?
I know patience…then patience…then ummm…patience:20:
Besides that, do you just make a point to check the chart every top of the hour or only certain time frames?
I’m just curious on your approach on finding entries and your time management.
I find myself trying to “make things happen” when its not there, just curious how you manage set-ups when you may have to wait hours or even days to see the right one.

Thanks!

Thank you for your kind remarks.

To answer your question simply, I would say patience. :smiley:

Ok this is what I do

I check the charts towards the closing and opening of each hour, especially an hour before UK session starts and religiously after that until I go to bed.

I also pay very close attention to H4 candles these days, so the 5 am, 9 am, 1pm, 5pm and US open 9 pm candles are very very important to me.

Its always a judgement call. Its 4.15 pm and I see a nice set up. Should I wait for H4 candle to finish at the end of this hour and a new one to start or should I enter now?

Questions that have no definite answers. Sometimes waiting for another candle saves you from a disastrous entry. Sometimes waiting makes ur SL too big for your appetite and that entry ends up going your way for a 100 or more pips.

So as usual, there are no hard and fast rules. So I take the best way, patience. It takes practice to be able to guess which is going to be the bank candle. It could be 2pm, or the 3 pm for UK session. Might be the 4 pm one where you get that one long candle that pretty much sums up your trading for the day. But most of the time, you can guess which one its going to be by looking at the previous hours candle sticks.

I dont have the issue of waiting for days cause my entries are based on H1. We draw our support and resistance from D TF, then down to H4, do some adjustments or if need be add a line for other S&R there. Then down to H1 and fine tune.

Do that for x number of pairs we trade. I am currently actively harvesting from 5 pairs only.

Once S& R analysis is done, we wait. We wait for our candle patterns.Flick through the charts once every hour. We will definitely see atleast one pair that will form perfect candles right on our S&R areas. These last two days EU and AU has been very perfect, down right to the candles on the Asian session. SL for about 5 or 10 pips. Good trades.

The pairs that either form candle patterns below the S&R lines or way high above the areas we have marked, we give it a skip. Stick with the ones that are following the plan. 5 solid trades per week is a given.

The hardest part that we need to figure out is do we take a bounce off an S&R area, or is it going to be a BPC ( break out, pullback, continuation ) trade at that line? That is the toughest question. I try my level best to answer this by looking at D TF bias and correlation. But then its not always that easy every given day.

I hope that has helped you.

EU H1

First bottom red line was my mornin marker for previous support area. See the first arrow on our left? That is where I saw the two perfect candles that showed me that something is going to happen. I took a buy on the third candle with a SL of about 20 pips. ( I know, I was too undecided very early in the morning. ).

My TP was at the wick of the earlier spike up. Exactly where my sell is currently.

Second entry, I could see a fall based on correlation and how H4 was looking but I could not see a very good entry point. I was rushing out so I took the trade regardless and smacked a SL right at the top of the previous support area, which is 65 pips away. Went out and came back in an hour and it had gone against me by 30 plus pips and it was dropping fast. I am 14 pips away from my TP. I am just going to take the 70 pips.

Oh and AU gave a classic Support broken, retested and became resistance on H4 TF. Did a quick one on that for 40 pips.

We just need to calm ourselves down, dont get excited and see it play out. Look for those pullbacks and enter there. Our SL is often so small. This is how I take risks up to 20%. Not simply jump on any trade that shows a 10 pip SL but to pick and choose and wait patiently.

Happy Pipping guys.

AU H1

The top most dotted red line and the bottom dotted yellow lines are S&R areas picked from D TF.

The middle red line is a best fit level on H4, which did not show on D TF.

We drop it down to H1 and the lines fit perfectly. Now the price has hit the middle line and is touching that line. We should always try avoiding a sell on this scenario. We are effectively selling at the bottom for all intents and purposes. It could just break through the support and keep falling. But most often than not, it will bounce back off and pull some horrid stunts before falling back. Or in many cases, it might decide to fly back up.

This is why many do not make it in trading. By the time our brain accepts that prices are falling, prices often are done falling. We have to be able to see whats going to happen with the charts. That, my friend is the toughest part of trading.

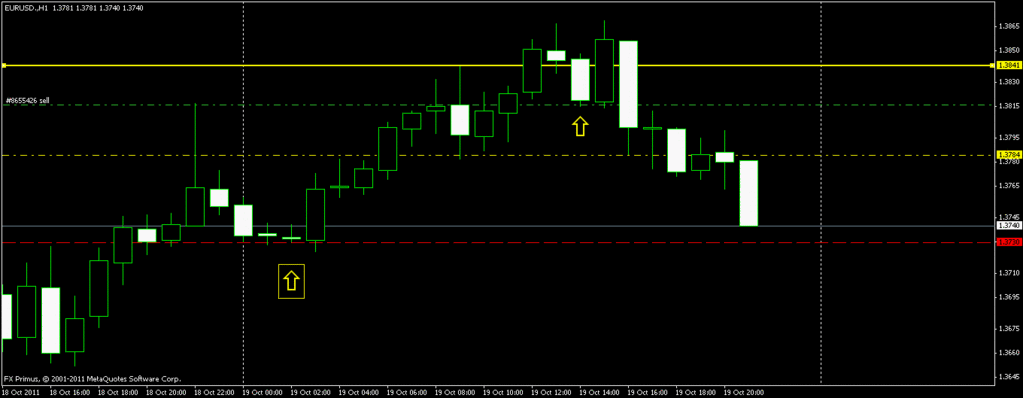
Now look at the Yellow arrow on our extreme right. That is where I caught my AU trade for 40 pips. Prices fell, through the D TF support/ resistance area from above, then it did a pull back exactly for an hour and the following hour gave us a beautiful entry with so little as SL. 40 pips is enough since I was already holding a good one on EU.

How do I know the S/R line is still valid? Look at how the previous H1 candles behaved on that line when prices were above it? Prices pulled back each time it was touched. Right on that line. So when there is a pull back and a new candle starts with a small wick at the top and starting to form a bear candle, we can say with confidence that its going to go down.

Now if I have to sell AU again what would I do?

I will wait for AU to go back up a little and maybe bounce off 1.0239 or 1.0271 if its very undecided.

Or I would wait for price to break the current middle line at 1.0226, do a pullback and see if a bearish candle forms.

We always wait for prices to pull back and test the area for an entry, which is what selling high or buying low means.

We dont enter now just because previous candle was a strong bear. Then we see it gives us 10 pips before turning back and shooting all the way up because we sold late! We sold at support. We buy at support, we sell at resistance.

So this is what I mean by patience. Wait for the candles to tell you something or for prices to retrace back to support and resistance areas.

That is the essence of support broken, becomes resistance, resistance broken, becomes support, buy low and sell high.

I am working on translating these to even higher TFs so I can finally swing trade. ( mind you I still dont really know what it means, except for the fact that we enter on D TF and hold for a few days ).

So hope that helps

I took the exact trade today for 40 pips. But my analysis wasn’t as thorough so my confidence was low.

Are you using the previous days hi/low as your SR levels or are you looking price action within previous days? I’m at work so I can’t properly study it at the moment.

I try to use the immediate S&R areas on the three TFs ddrankin.

I look for Support and Resistance at D TF, H4 and finally try to adjust it so that it will be a best fit line on H1.

If bias is strong and its shooting one way for a few days, then H4 or H1 would give us our HH or LL inside the previous day candles and I wait for pullbacks to these areas.

I also mark Support and Resistance areas based on previous wave movement on the same price area.

Sometimes its tough when its trending strongly and our immediate nearby wave can only be seen when we zoom out extremely. But since its trending one way strongly, it wont always come back to previous D TFs LL or HH.

hope that helps.