Pure Price Action For Dummies

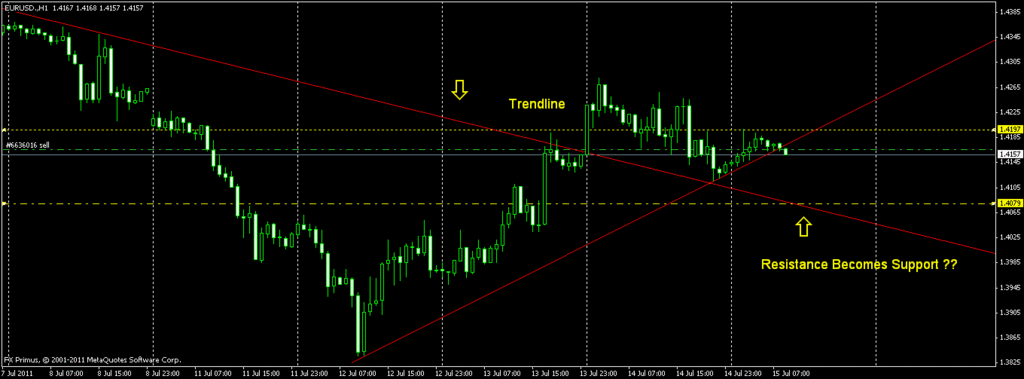
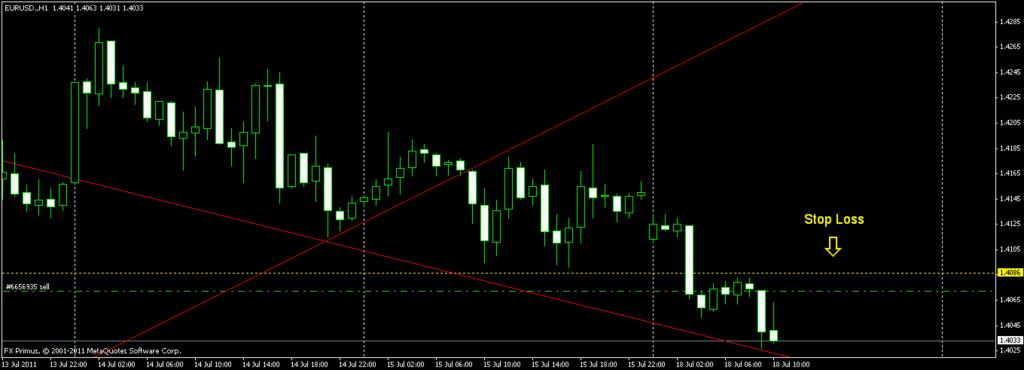
EU 15th July 2011.

EU H1 TF

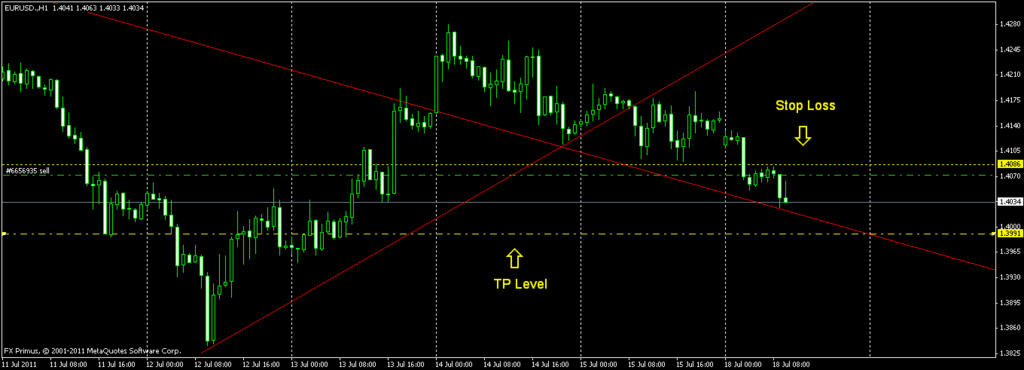
EU H1 TF

Yellow line on top is possible SL area.

Yellow at the bottom is possible TP area.

This might go down further south from TP area.

Happy Pipping.

(( P/S : Trendline Analysis Provided courtesy of YANIU. Thanks buddy. ))

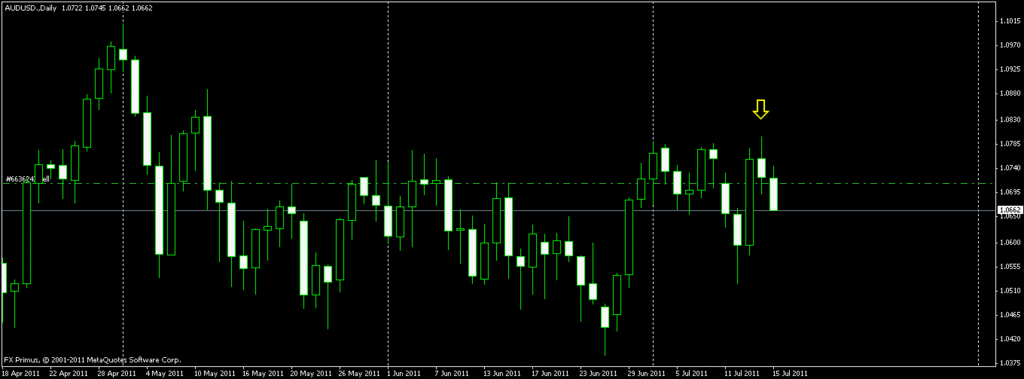
AU D TF

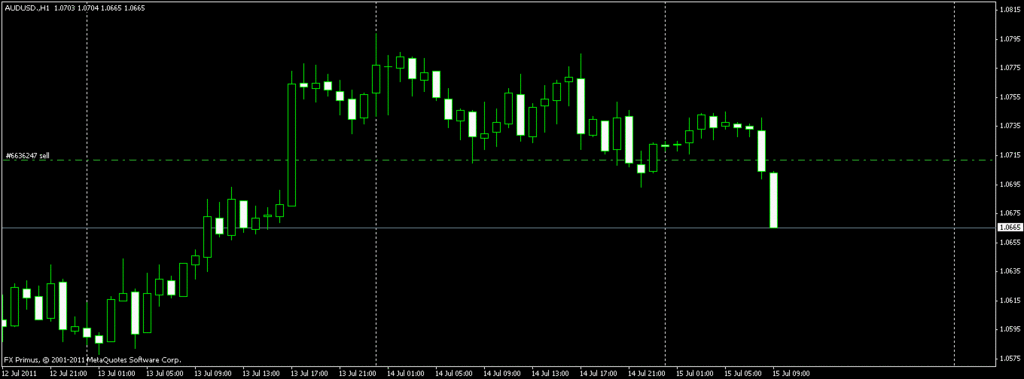
AU H1 TF.

Entry was late. Late by about 13 to 15 pips.

Moving SL to high of current candle as I also have a EU trade open. Dont want to have both go against me if things go sour.

50 pips now.

Happy Pipping.

(( P/S : Out of AU with 70 pips. EU is left to ride with SL at BE +5 ))

Coooooooooool!!

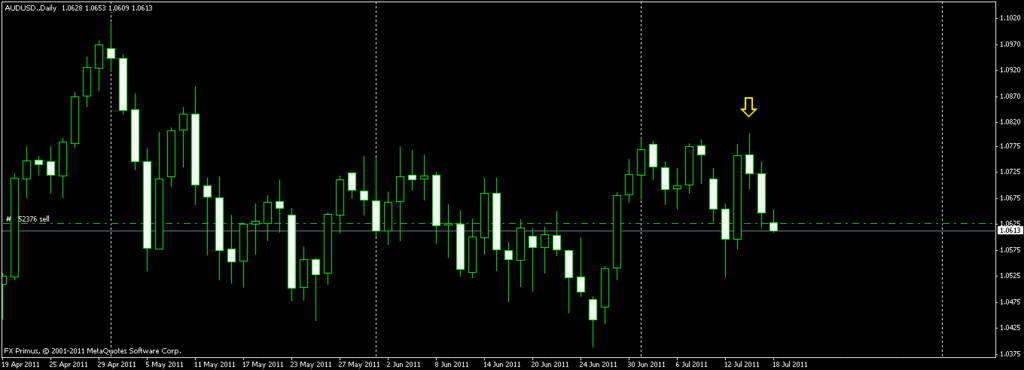
The way that I’ve entered this trade is off the Daily Chart.
If you take a look at the Daily Timeframe you can see a HUGE rejection candle, I’ve simple set up an order to sell at the 50% Level of that pin bar, that way stop loss is minimized.

My order was filled at 1.4196 and today’s high was 1.4197 so it was a perfect fill =D

Also, if you draw an UP TREND LINE from the Daily Chart, you’ll notice that price broke that trend line and pulled back to it, thus resulting in the huge rejection Daily candle.

All this are more odds to stack in your favor so you are confident of the trades you take.

Enjoy

Thank You for your trendline analysis Yaniu.

Happy Pipping.

Just shorted gbd/aud for 10 pips (yey) and now looking for shorting cable if it falls below 1.6085 or even 1.607. looks kinda risky :51:

Dissecting posting number 41.

EU H1 TF
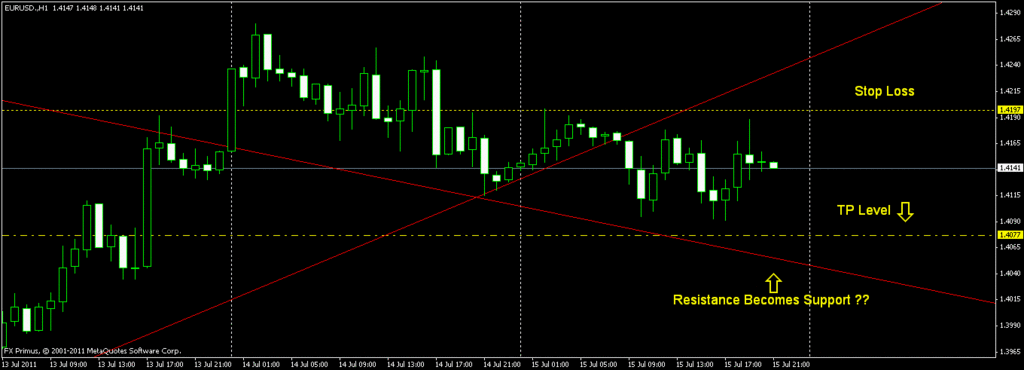
Gave us two opportunities to TP in a range of 30 to 70 pips.

Notice our SL at the Yellow line.
The SL has been a strong and valid a one. Please note how the final spike 3 hours before this screen shot was done, came so close to the SL area but did not cross or hit that line?
In this case, the HH wave worked as a charm. We say the SL was a valid one.

Please take note on how SL is put on the peak of a wave ( either previous LL or HH ) and not set as arbitrary values. Pay attention to the statement above.

When traders say that " my trading system has a SL of 30 or 50 or even a 100 pips", then what they mean is that is the range of their SL. That is the maximum loss that they are prepared to accept.

We have to see if the trade setup that is unfolding infront of us has valid areas of LL or HH that can be used as a SL and the pip count from the entry should be inside our SL range.

The lower the better. If its higher then we dont take the trade.

The SL has to be valid. It depends on the wave patterns. But which ever it is, the SL that is on the screen should be inside the range of our acceptable loss. Part of how much we are prepared to risk as per our money management.

This is where our system comes into play. If our system is one that gives us a profit of a minimum of a 100 to 150 pips, then I guess its fair to say a SL of 50 pips max is acceptable.

If the system that we are using gives a max of 20 pips per entry and its not wise to hold for more, then what is the point of taking a trade that has a SL of 50 pips as per current wave??

“As per my system, the SL is 40 pips and its rarely hit/very safe” does not mean that the System will ensure that it will give you an entry that rarely goes above 40 pips as Draw Downs. ( DD ). It just means thats the maximum I can risk as per my money management and the risk to reward ratio my system is capable. It does not mean that the damn thing is safe and it wont be hit!

You decide to pull the trigger as per your system after considering a range of things. One of it is the value of a valid SL in the current set up. Just smacking a cut off order 40 pips from your entry point just because your system says that the SL is 40 pips is going to make it much more difficult for you to be a profitable trader.

Remember, this is a numbers game. And in any game that is based on numbers, any small itsy bitsy tiny little thing that you do to improve your chances of not being eaten by beings that are much much much much more bigger than you in this pond will go a long way to ensure your survival and growth.

I hope that explains SL.

Its not about the value. Its about the waves.

The same goes to TP. Statements such as a trade has to be 1:4 ratio is a guide. It does not mean that for a 25 pip SL, you must have a TP of 100 pips. You are in a profit of 70 pips and it sort of stalls, or has hit the previous LL area, or its hit a resistance area, or its going to go out of the market times you normally trade and you dont TP?. You going to say look my Risk to Reward ration is 1:4 so unless it crosses a 100 im not cutting and banking??

Dont take it literally.

Trade entries as per our system become much more valid and ensures us a much higher rate of success in this business when we start paying attention to such details. These are the sort of small details that maximizes our chances of growth.

Remember,systems or a set of indicators are not the same as a crystal ball that foresees the future. ( and if you are having any bright ideas, there are no crystal balls that can see the future either.)

It cannot tell you where the prices are going to go more accurately then your cat can. ( If your system can do that, then your cat can too. It licks its paws then buy, it licks its underbelly then you sell, it licks its ballz, you stay the hell away from the market. That is a valid system also. I call it the CAT System, USD 3999.99 retail, now for USD 599.99. Hurry limited time only. For the first 500 suckers).

A system is just a reason for us to take a trade at a particular price level. Its just a guide on where we can TP and where we can put in a SL. You need to work out the details of the system to maximize your chances of profiting,

Dont be blind in looking at the blinking indicators and keep pulling the trigger because your system just showed an entry. No amount of maths is going to save your money if your trading is mechanical in nature and you work your chosen system that way.

If you have a system that is very profitable for a given time period and then falls flat on another stretch of time, then you are being mechanical in some aspect. You need a diagnostic exercise and a system tune.

Happy Pipping.
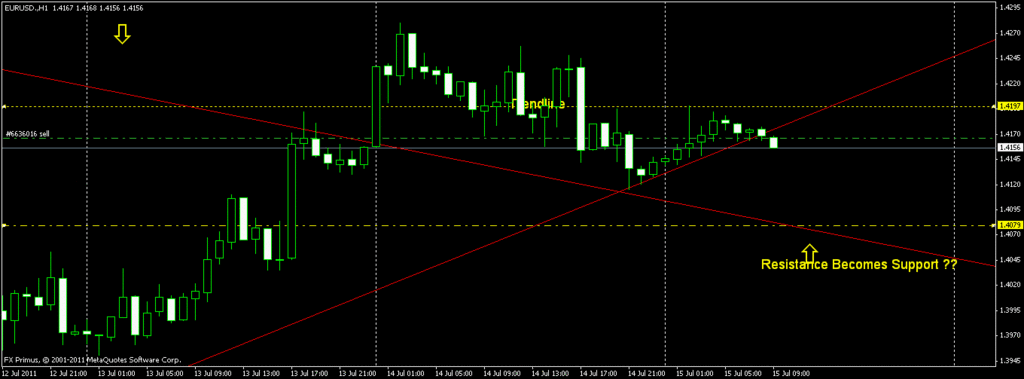
Bingo thats how I trade and if the 50% of the rejection candle is still to high for my risk management I will just drop to a lower time frame and look for the same thing in the same direction of the daily TF

Great post girl. wish alot others would understand what you said about SL that is one of the most important parts of entering a trade IMO and you hit the nail right on the head. If you just place a SL of 40 pips because thats all you can afford to risk then you did not analyze your trade you might bee in a great trade but you could not afford to trade it then you must let it go and wait for the next. I see so many people fail for that one reason. I cant explain it as good as you did great job.

Thanks you Bobmaninc…

Had a list of things that I wanted to put up on point form.

Things that would have shaved alot of time off my learning process had I knew then.

But instead of putting it all up in one go I thought Ill slip it in one at a time as this thread goes.

Hope it helps a few of the newbies to shave some time off their learning curve.

Happy Pipping.

I agree with you dont overload with info or it will be forgotten. But that is a very good point to start you must must must put a stop loss that makes sense to the trade you are taking if not there is a very high probability you will be taken out. and if the risk is to high for you dont take the trade no matter how good it looks. I will be fallowing this closely as there will be alot to learn here. About time someone made a thread that is on price action trading and is on a easy level of speaking so people can understand it.

Nice strat Niki,

You rolling with this over the long term?

Will be following,

Great profits to ya this week

Thanks MoneyNVRSleeps.

I was learning with the help of a senior trader for about a year plus and he had thought me a few strategies etc.

Was all ok and profitable but there was something missing.

And taking trades were a stressful affair because it was trading by system and losses were also there.

I was looking at the charts one day thinking of how nice and profitable this would be if I could see where the price was going to end up while I was looking at UCHF D TF.

It then hit me on what I had been really missing. A way to make my trades nearly always profitable.

The chart was in a sweet position and price action sort of just spoke for itself.

It has been one hell of a ride since then. Been doing this consistently now and my account is growing. I take a minimum of 10 % risk per trade now and the rate of growth is really phenomenon. My max risk on a trade has been 30%, once or twice before.

I wont encourage others who are just starting out with this method to do the same. But I can assure u that its possible to do so.

I am enjoying trading like never before and I no longer have stomach cramps when I enter trades or watch a trade go on a draw down, not knowing if its a draw down or a move against me.

My trader friend who thought me trading said never predict, never guess, never think what the market is going to do. Pull the trigger only when you know. I agree with him on that now a 100%.

I hope the thread helps as many as it can.

happy pipping.

this is so cool…

i just decided to return to trading again after my initial lost few years ago :frowning: and i’ve been looking for something simple. exactly like this! i’m not smart enough to understand those colorful charts or even the indicators
btw, how do you determine the TP and SL?

thanx for sharing this

Welcome back to trading villain.

I guess most of us loose some money when we start of.

The important thing is you still believe that the market can give you a buck or two and you come back to learn again.

I hope this thread simplifies trading for you. I went through the hard way of learning, but I was lucky I had someone coach me on real time so that I was slowly but steadily progressing further.

When it was all done, and I was steadily making a pip here and there, I thought why not I write about trading in a simple way so that the process is much more newbie friendly.

Hence this thread. I believe anyone who has gone through Babypips School and wants to start learning to trade a demo should be able to follow this simple method.

We should add more to our plates as we go, rather then pile the plate up on day one and try to sort our way through it.

In regards to SL and TP , the simplest answer would be to place it on the nearest Higher High ( HH ) for a sell or Lower Low ( LL ) for a buy trade.

Ill try to write up a post somewhere in between trading in regards to SL and TP with a chart or two later today.

Happy Pipping.

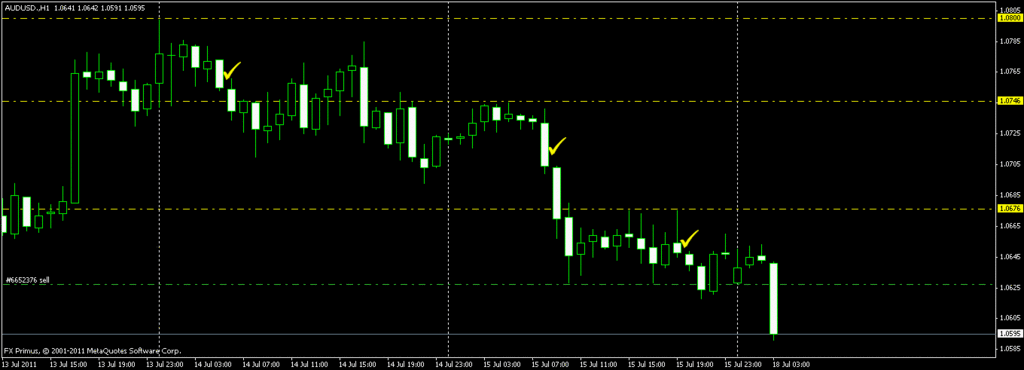
AU H1 TF

If we are to imagine that for some reason we had decided to sell on the candles being marked by the yellow tick, then the most reasonable or valid SL according to waves on H1 TF would be marked by the yellow lines.

Please look at the chart from left to right, the first and top most yellow line being the SL for the first left most tick.

The second yellow line is the peak for an entry marked by the second tick.

Note how the previous HH was picked as the obvious choice as the smallest available SL for that particular trade.

This is one of the most basic way of picking a reasonably valid SL.

The current entry that I have entered, presented by the last green dotted line on the last H1 candle will obviously have a SL at the HH of that wave. Which would be at the top of the wick of the previous candle.

Take note that the SL has to be at the peak of the wick in order for it to be valid.
( this is demonstrated in the chart by the first entry and the first SL level. Notice how a price spike has happened somewhere towards the end of Friday and had our SL been on the candle opening level of the first SL instead of the wick, our SL would have been hit. )

Now we can go more detailed and pick a stronger SL by looking at trendlines or channels etc etc. But that would come later in the series.

For now, HH and LL as our SL as per wave would be sufficient enough for us to have safe trades.

I hope this helps.

Happy Pipping.

What does your daily chart look like on on that AU ? some of your candles look different from mine, maybe because of a difference in brokers.

AU D TF

Talon D, I had the same problem with my charts.

This was until Bobmaninc pointed out that a proper chart should have only 5 daily candles, instead of 6 like the MT4 chart that I was using previously. The 6th candle was a Sunday candle.

The new charts from a different broker has 5 and I am much more happier with this. But it still varies slightly to the D TF candles on my Tradestation charts.

This is because of the different closing and opening times of the charts I assume.

What do you think??

yeah, I use IBFX demo mt4 for charting and it does show the Sunday candles. I can see differences on other candles too so you are right, different times of different brokers. I’ve been too busy to trade lately but will give your method a try. It is similar to the daily breakout I was using back some time ago but then I started counter trend trading.

EU H1 TF

Please note tight SL ( 17 pips including spread ) on trade entry. This was subsequently moved to BE +1 ASAP because still holding AU trade from the morning. I dont like to take multiple entries. Further more, trading two pairs that move the same way at the same time is not very wise as in all probabilities, if one goes against you, the other will move against you also.

EU H1 TF

When we enter trade and pick SL per wave, wouldnt waves be also applicable for TP??

This is an example where we would put our TP if we were to let it ride to the next possible resistance area. Again this is just a rough guide or idea to possible TP areas. I will write up on TPs in more detail as we go.

I would like to remind newbies two very important things.

  1. The market will always move up and down. We cant take it all.

  2. 10 or 20 pips banked into your account is 10 or 20 more pips then what is out there.

I have a compounding projection chart. I have a set TP( 60 pips per trade ) for a trade and I am more than happy to take whats there when this level is hit. Sometimes I take 1/3rd of this or 50% of the 60 pips in the first trade and cover the rest on my second. I do leave some entries to run close to 100 pips, but that is when everything looks rosy and I dont see why it would retrace much or reverse.

So what happens after the 60 pips? I up the number of lots for the next 60 pips. This way, I keep my risk pretty much the same but I get more for every 60 pips. This is called the compounding effect. Putting your money to work for you.

More then a trading journal, I will suggest newbies have such a projection chart. If forex was run like any other business, then this projection chart is your business plan.

Without this, you are not going to be growing your account as fast as you should and could.

I hope that helps.

Happy Pipping.

i was looking at the EU charts last night, with only the trend lines and umm… the fibonacci retracement :8:. i used to use it to find support and resistance lines where usually put my SL and TP. i didnt open any position but just guessing that it would go down to certain line. well… it did go down. then i checked the other related pairs. just like you said… they were going the same way.

i’m familiarizing myself with the candles now. hopefully in next few hours i’ll open my second first position again (in demo account of course):stuck_out_tongue:

btw i’m adopting your trading rules for my trades. i hope you dont mind.

cheers!