If a resistance or support zone breaks, the zone will stop beeing a resistance or suppor zone?
Support and resistance are important for trading because you have to set targets depending on them.
This is a great question that points to the problem with s/r levels. When a support level breaks it might become a new support level again 3 minutes later or 3 years later. Or it might not. And when the support level breaks it can become resistance 3 minutes later or 3 years later. Or it might not.
So when you are sick, and you go to a doctor and he says, “Drink this medicine, it might cure you in 3 minutes or it might take 3 years. Or it might kill you in 3 minutes or in it might kill you in 3 years.” Think about the doctor - would you say he was a good doctor?
Not necessarily, it could just be a “fake break”, meaning price appears to break through a S/R level just to come back again. Some would say this is “stop loss hunting” meaning large financial institutions are moving price to where the masses (retail traders/you and me) have their stop losses or buy/sell orders set, to take them out so their orders can get filled.
This is of course, is (arguably) just theory (conspiracy). But not sure anybody really knows, except maybe the market gods.
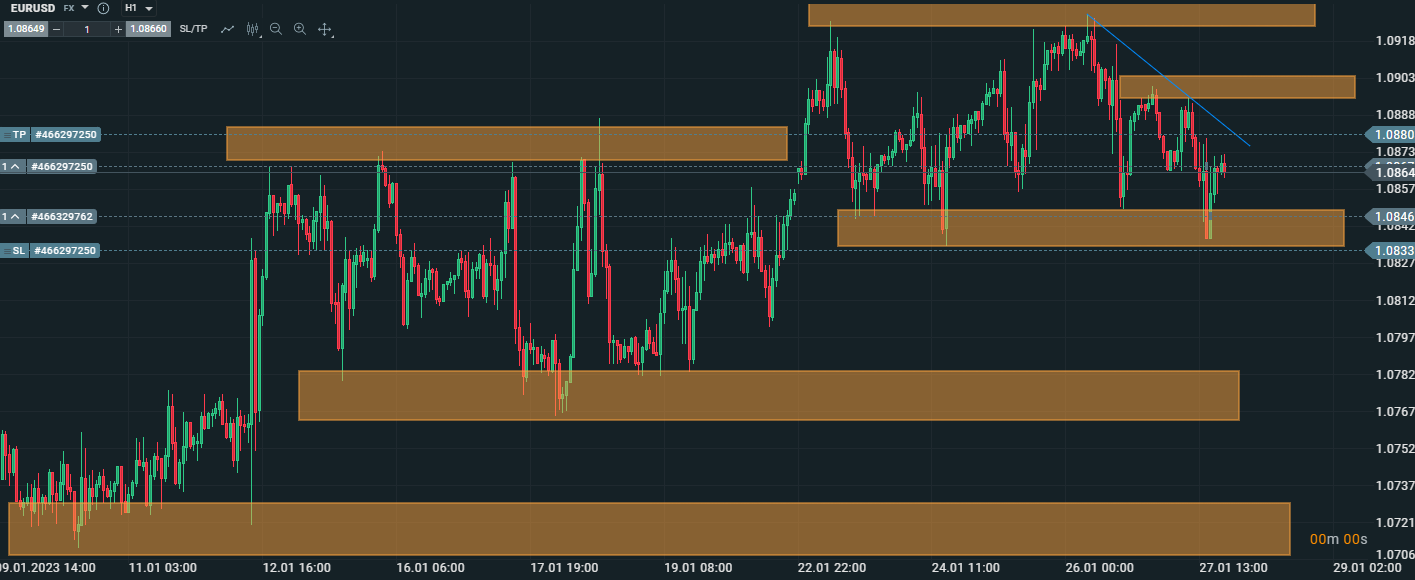
If a R zone breaks, it can then become a S zone, particularly in an uptrend. These are ideal setups that I look for. Here’s a good example using the EURUSD 4H chart:

Remember that these are “zones” not lines. You can see here some ideal entry opportunities using this strategy. However, @tommor could argue that since this is in an uptrend, you can enter anywhere on this chart regardless of the S/R zones and with some patience you would still make money. And he would also be right. But what I’m demonstrating is that you can use these areas as signals to buy. You can also use these areas to place your SL and TP.
You will also find that when the main trend reverses and price eventually starts falling back down,it may (or may not) use these same areas again.
Looking at that chart you may think “Hey, that looks easy, I can do that”. It’s not! This chart is hindsight. These areas take time to develop (and practice to find), and price needs to touch them more than once before they’re even considered S/R areas, so you need to be patient and wait for them to form first.
Bottom line here is, whether you want to use S/R levels or not, be sure to also implement price action and trade in the direction of the long term (daily or weekly) trend.

3 Likes
Market’s support and resistance level are essential for setting targets.
Can you please rate my R zones, and S zones. I am really a begginer, and I dont want to start this with the wrong foot.
1 Like
I think you’re on the right track. Keep in mind the lower the timeframe the less “predictable” price can be, which is why I only look at 4H and up.
Most of the areas you have marked here are obvious, which is what you want. Once you find yourself struggling to find areas of S/R then move on to another chart, you want these areas to be obvious and to stand out. If you’re not sure, don’t mark them.
2 Likes