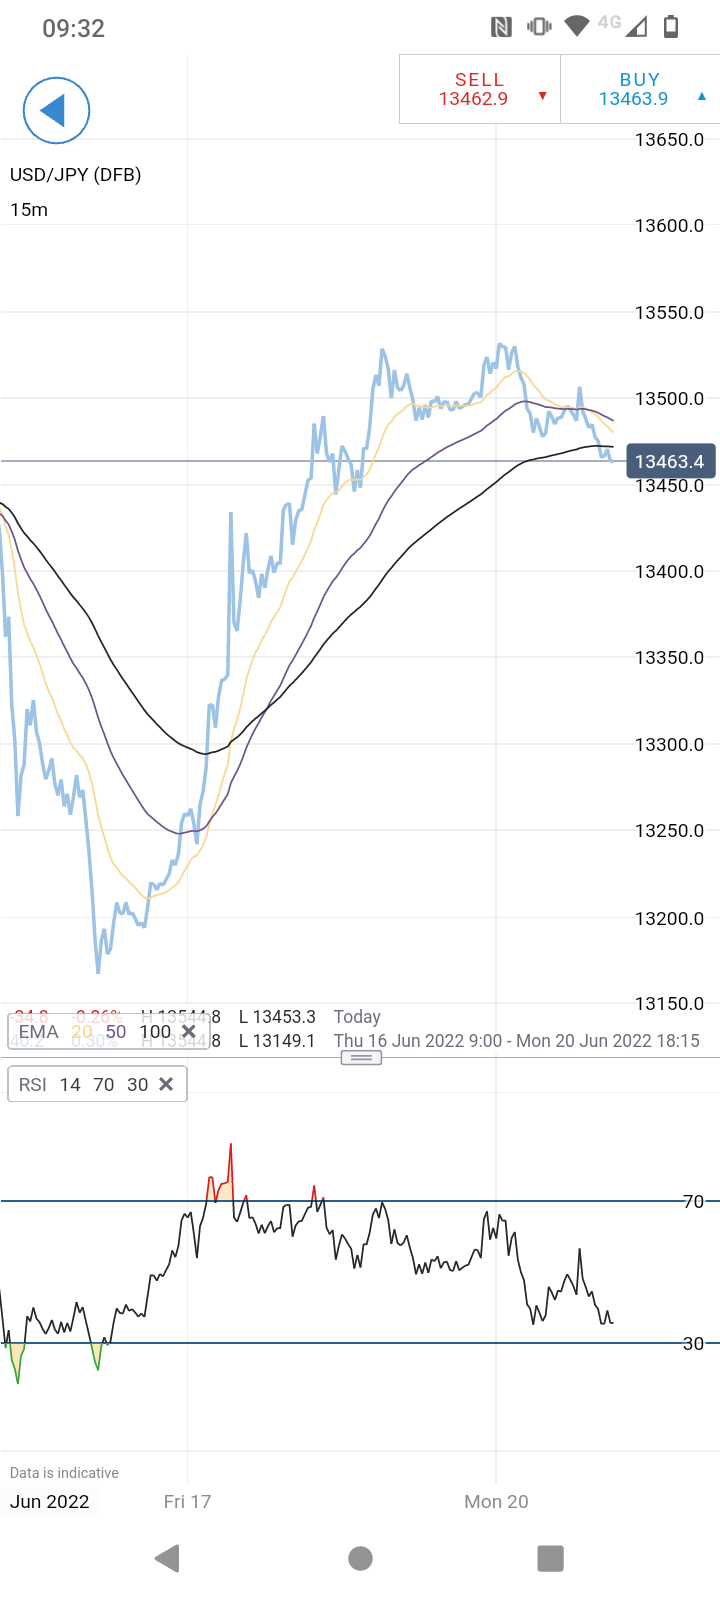
As you can see on the graph above the RSI (set to normal parameters of 14) was showing that market conditions were overbought - and this would usually indicate that it’s time to sell .
However as you can see the price in fact continued to rise in line with what the EMA crossover predicted.
I can’t understand why the RSI was giving a misleading signals on this occasion and suggesting to sell .
Indicators are not reliable as timing signals for anything - whether to enter, exit, add, reduce, or anything else many experts suggest.
They can be very useful as “environmental” monitors - so they can confirm a set-up or a particular market condition. As an example of this, the MA crossover is a notoriously rubbish timing signal: they do show that market conditions have changed, but by watching price you already know this was happening.
Sure. On all pairs I would recommend moving to D1 time-frame or as near to it as you can get. I know that people say time-frames are fractal and that pattern X over 50 D1 bars is the same as pattern X over 50 m5 bars but that’s just opinion - there isn’t anything as far as I know in the public domain that distinguishes between TA on different time-frames except in the coarsest manner - longer is better, shorter is worse.
Price is the primary data. Indicators manipulate price data to give conclusions, but whereas recent past price behaviour might be say X% reliable with regards the near future, its hard to logically argue that derived information could be more reliable than the primary data.
Forex price is driven purely by huge international firms. I follow what they’re doing because they are smarter than me.
Because RSI and all indicators should simply be something else to observe if you want on top of studying what price is actually doing. All you need is contained in price action and some feel indicators lend extra validation to that. But they might not always as in this instance. As @tommor says, price is driven by people smarter than us and with far deeper pockets. Try and stay on the right side of what they are likely going to do and you’ll be fine.
@tommor Thanks you very much for your response. I really appreciate the explanation , and it does make a lot of sense .
I have been looking at economic calendars for the USD/JPY to act as catalysts, But I will try to keep my ears and eyes open for information from large retail investors.
If you want to disclose any information regarding some news/sources (regarding retail investors) I would be most appreciative, however I respect that you may not wish to disclose this .
Thank you for your help, I hope you have a good week.
During violent moves up there is no such thing as overbought. When market is hot it can go in the same direction longer than you can stand your ground So generally, it’s better to look only for oversold during uptrends and overbought during downtrends.
When market is mild (range moves, weak trend, old trend losing steam), RSI tends to be more reliable in both directions.
Never underestimate markets momentum - it can break through every indicator and chart pattern.
Actually I find no value watching/reading financial/economic news. The most I do on FA is note when interest rate announcements will be plus the US Non-farm Payrolls, and avoid holding short-term positions across these events.
An indicator is a numerical representation of Price action. If you look at the 14 candle span before the price hit the overbought area you’ll understand why the RSI line rose as much as it did.
You’ll also realise if you tinker around with the settings that if you’d increase the duration to account for the whole spike down it wouldn’t have considered it overbought. That’s because it’s comparing the values relative to the inputs (14 candles).
You generally use oscillators in ranging markets. It’s a good entry/exit signal if price is moving within a range/consolidation. But even so you have use it with other indicators that give you an idea of what the general market environment is like and know when to apply it.
If you’re keen on using it it’d be good to be familiar with the math behind it and read up on strategies that use it with other indicators so you know when to apply it.
I can’t understand why the RSI was giving a misleading signals on this occasion and suggesting to sell .
If you understand how RSI works, it’s not necessarily “misleading”.
RSI measures average gain by the average loss over a certain period of time. Basically, is the currency pair gaining more than it’s losing? The price can’t continue to gain infinitely.
Since USD/JPY kept going on in one direction (up), RSI reflects this. Price closed higher than its previous close, and the actual gains per close continued to rise.
For example, over 3 bars, if price gained on 2 bars with an average gain for 50 pips and had a loss on 1 bar of 5 pips, does this mean it’s “oversold”?
Not necessarily. If there are no sellers or if buyers continue to exert strong pressure, then price will keep going up. And so will RSI if gains are 50 pips or higher.
It is really important to watch market structure and price action before any indicator. They may tell you a retracement is coming but you have to have an SL and TP in place that isnt large as you are going against the trend. You would want a break in market structure to sell for a longer period of time and that wasn’t happening on your chart
Default trading tools are useful, but you can’t rely on only the default trading tools! Actually, you need to purify your trading setups by many parameters; so don’t follow this type of tools so seriously!
Agree completely. Look to price action first and foremost and then see if an indicator supports a hypothesis. No higher time frame structure break? Then it simply doesn’t matter what RSI says.
Other thing is, that there are many ways to use RSI.
You can use RSI(2) or RSI(3) with extreme levels (80-95) to hunt for short term momentum.
You can use RSI(>20) with level = 50 to show, if overall market is bullish or bearish
You can use standard RSI(14) and trade actually any combination of signals Buy on entering overbought, sell on entering overbought, sell on leaving overbought, sell on first RSI lower than previous RSI while being in overbought
Going for multitimeframe RSI (eg. D1/W1 RSI(21) > 55, H1/H4 RSI(14) < 30, M15/M30/H1 RSI(3) < 10)
For me it was beneficial to try to backtest and look at them all. It was not very profitable, but allowed to better understand how RSI moves with the market.
 So generally, it’s better to look only for oversold during uptrends and overbought during downtrends.