As of 22 September, Shanghai Composite Index (SSE) is up 6.9% despite the geopolitical tension with the US and coronavirus pandemic. Contrast this with S&P 500 which has YTD performance of 2.1%. Part of the reasons for the resilience is due to Chinese economy relatively speedy recovery from the pandemic. After the initial breakout in Wuhan, Chinese government took a draconian lockdown which successfully contained the virus. Although occasional breakout still happens, China’s effort in containing the coronavirus is pretty successful compared to some western countries.
China GDP comparison
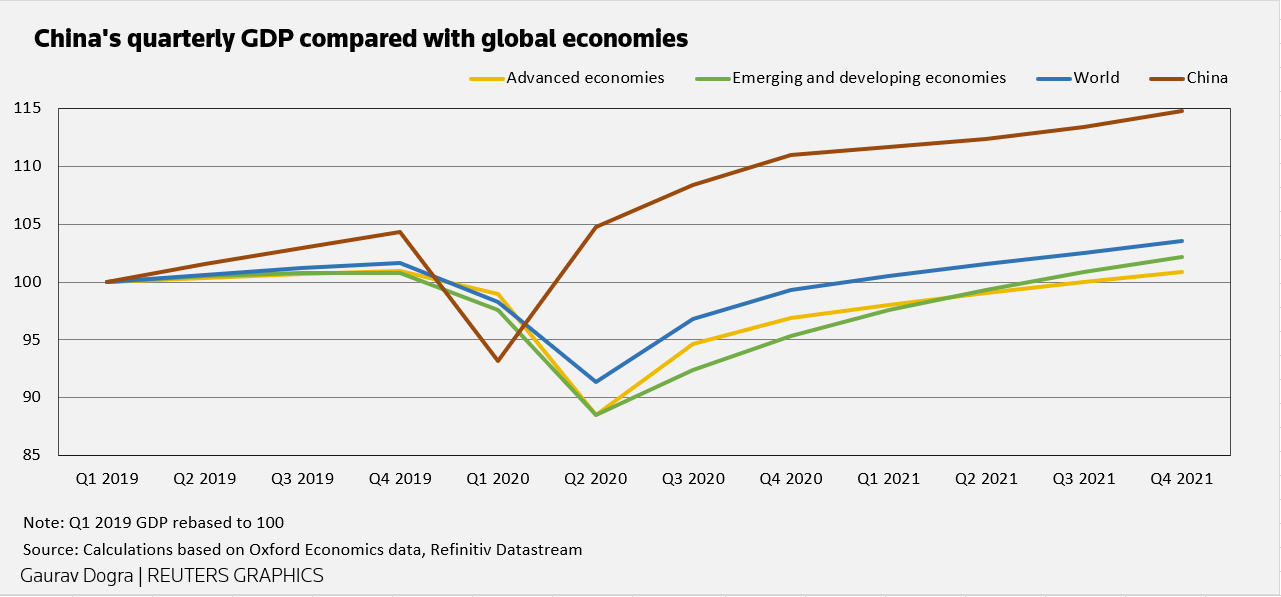
Compared to other countries, Chinese economy and business activity recover and restart faster. Refinitiv data shows Chinese firms would see a net income profit growth of 6% this year compared to the average 20% decline in global companies’ earnngs.
Shanghai Composite Index (SSE) Long Term Elliott Wave Chart
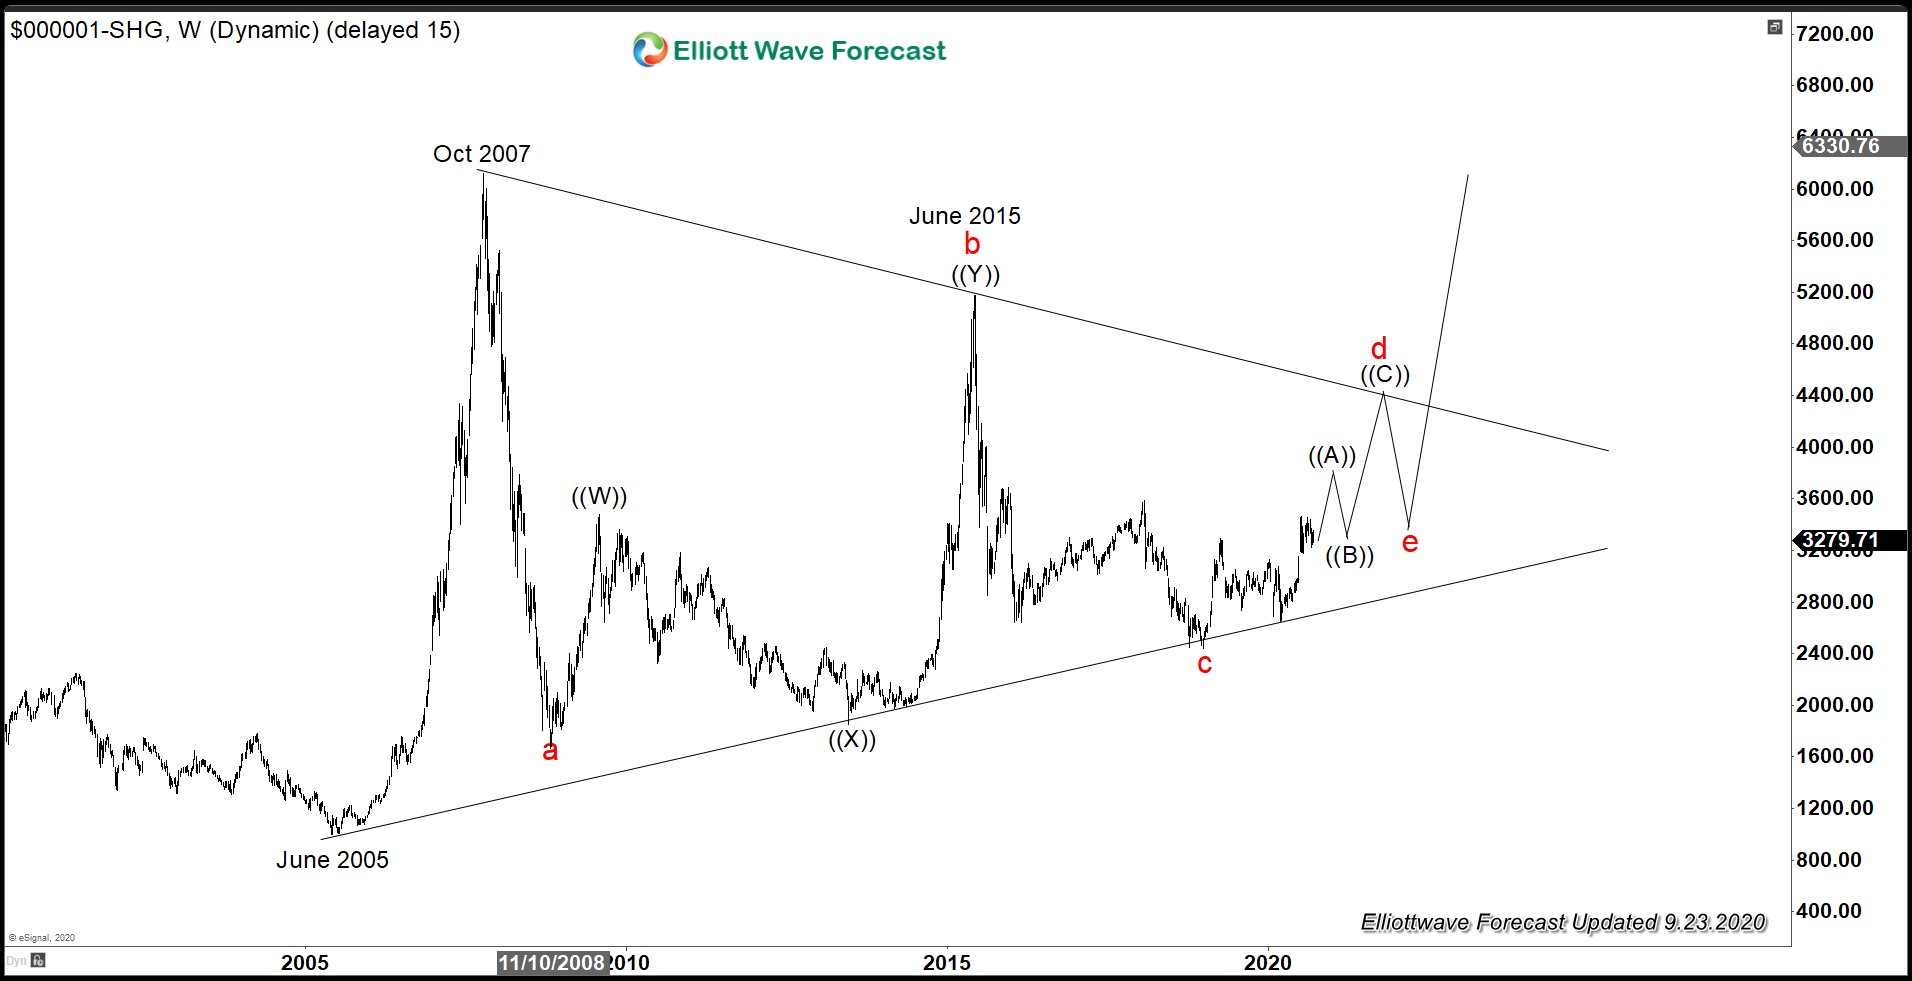
A long term outlook in Shanghai Composite Index (SSE) shows that the Index still remains in multi year triangle consolidation. We believe the consolidation most likely should resolve to the upside. However, due to the size of the triangle, the Index can easily continue to consolidate in the next few years. Shorter cycle, the Index can retest the upper line of the triangle around CNY 4400 in the next few months before pulling back again.