$SMH Semiconductors Long Term Cycles & Elliott Wave
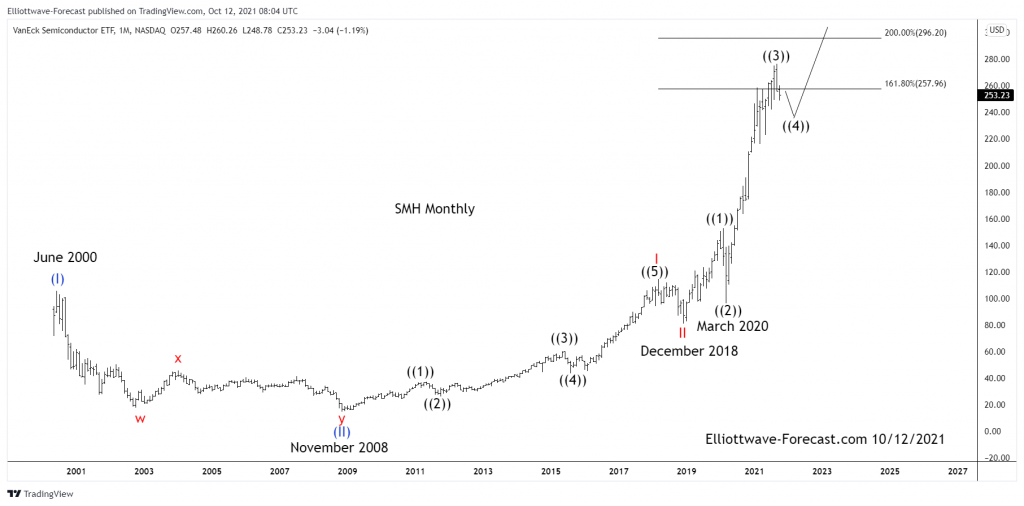
Firstly as seen on the monthly chart shown below. There is data back to May 2000 in the ETF fund. Data suggests the fund made a low in November 2008. This low has not been taken out in price. The cycles in this instrument tends to reflect the Nasdaq index fairly well. However it has a larger degree difference in that the Nasdaq made a low to correct the cycle from the all time lows in October 2002 compared to the low made in November 2008 in the SMH semiconductors.
Secondly every way I count this data it suggests several things. Several counts are always possible however the wave (III) in red & blue are still in progress as per the best reading of the cycles.
The analysis continues below the monthly chart.
Thirdly it appears a wave ((3)) can have already ended and the instrument can relatively soon end an Elliott Wave ((4)) pullback to correct the cycle from the March 2020 lows. The wave ((4)) should see only around a .236 to .382 retracement of the wave ((3)) before turning higher again in wave ((5)) of III.
In conclusion. It appears the pullback in wave ((2)) to the March 2020 lows corrected the cycle up from the red wave II lows from December 2018. I always like to give the trend benefit of the doubt. In this case it should be obvious the trend is higher. The longer term lows highlighted on the chart suggest the SMH should trade higher. This while pullbacks are shallow and show they will remain above the March 2020 lows. Furthermore importantly while it’s above the December 2018 lows according to the price data currently available.
