Things have been a bit choppy since my last update. Beans have been showing some tight correlations to CRUDE and CORN. The big CRUDE selloff MAR 18 took the entire commodity complex down. Beans actually showed relative strength and outperformed all AGs (agriculture) the following sessions. However, oil needed to retest those lows around 58 on MAR 24 CRUDE took everything down again. Beans were tight w/ the 10YR (ZN) but that correlation gave way after volatility dried up and rates settled down.
I’ll start w/ some intraday price action analysis for the prior trading week.
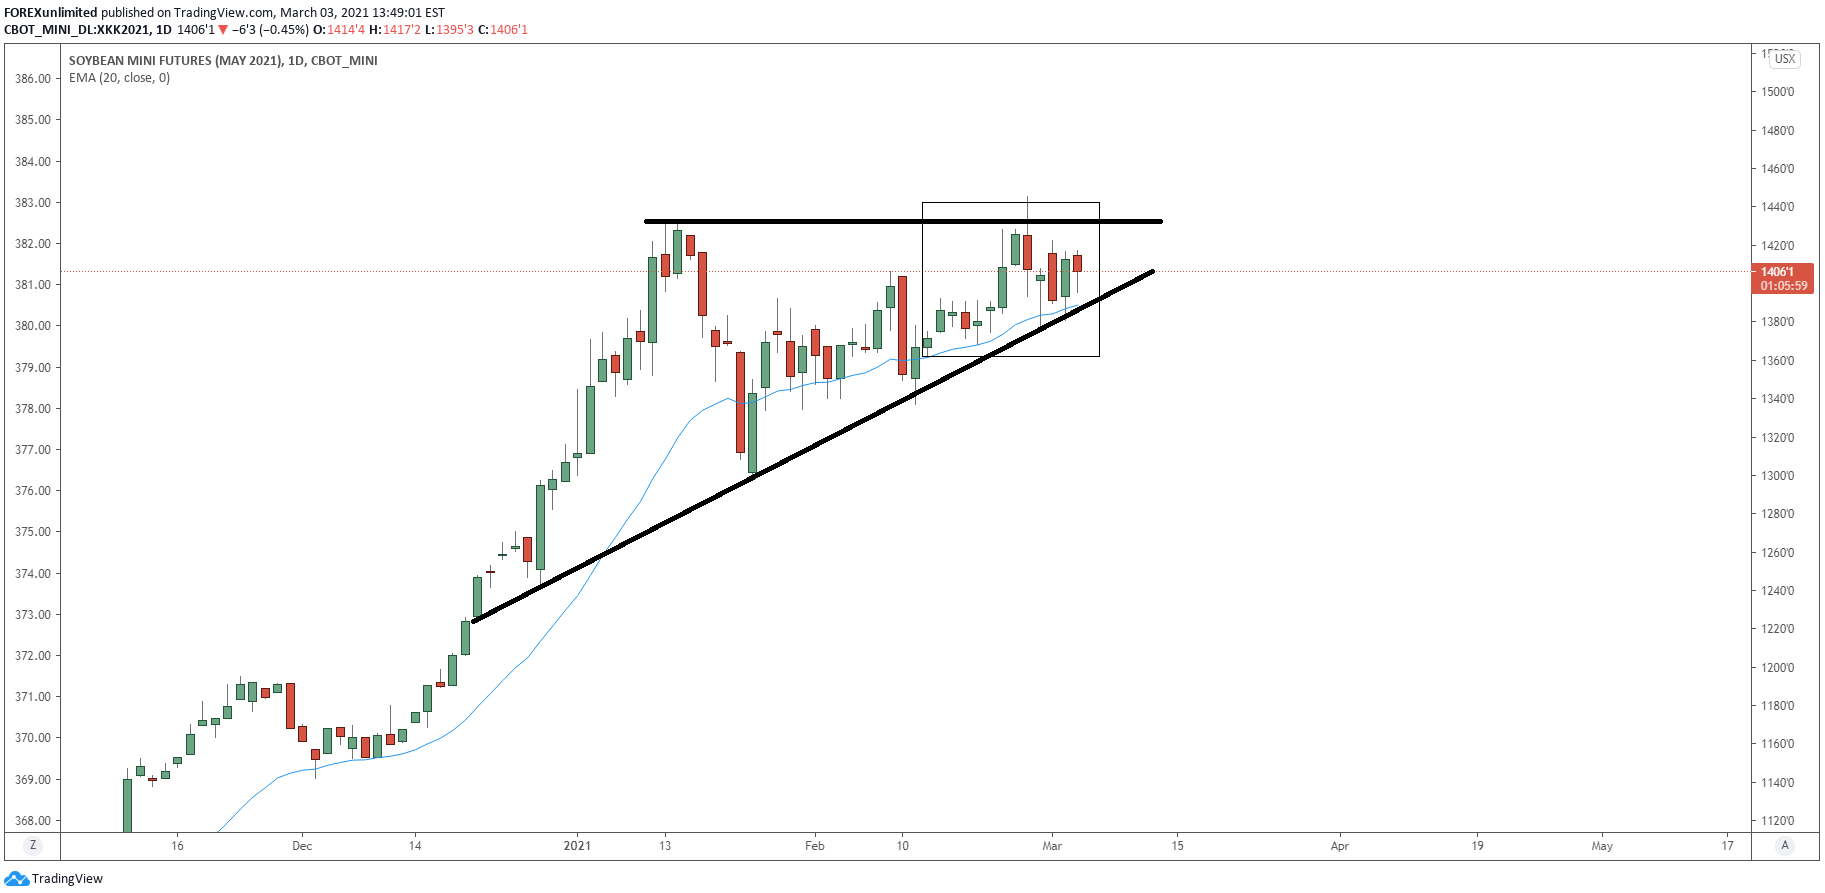
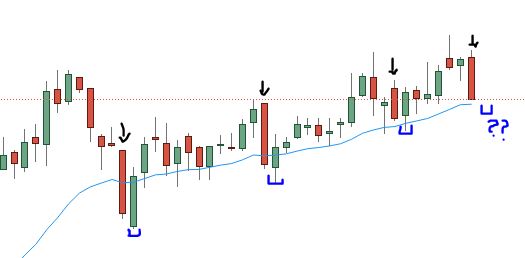
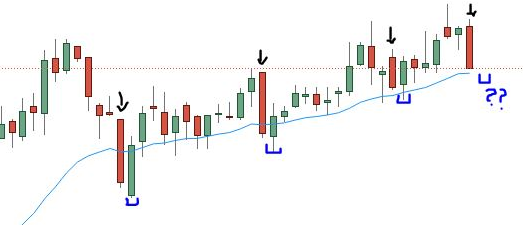
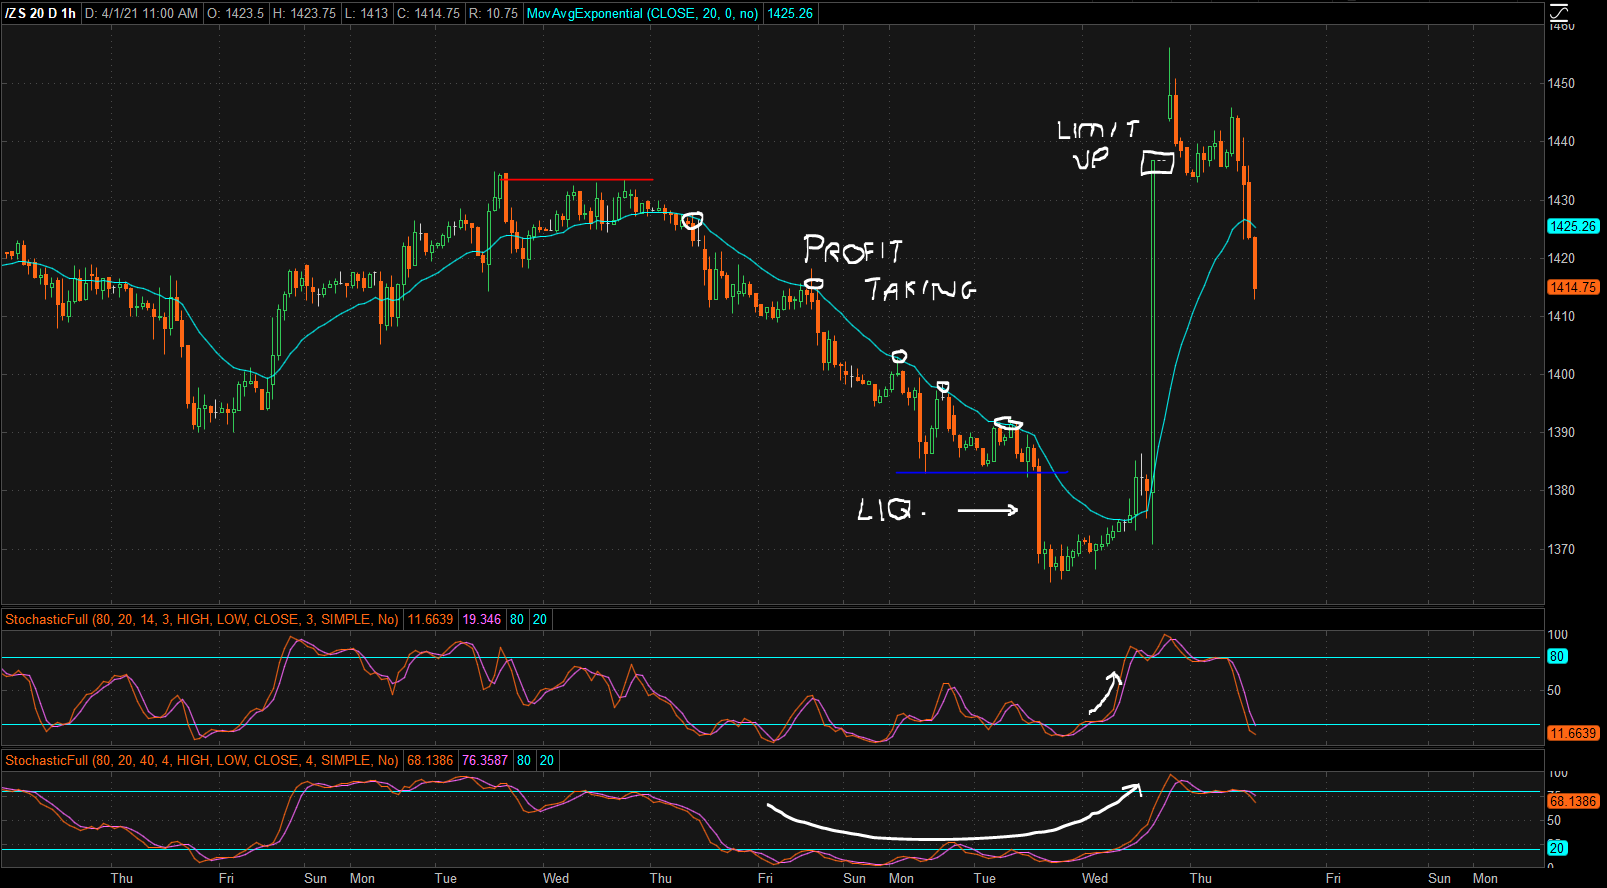
(1) The primary focus is the triangle pattern. There are 3 key swing highs and 2 key swing lows (marked by X). these patterns typically resolve in the direction of the primary trend, and lend to pretty explosive price behavior as the market coils up toward the apex / resolution point of the triangle.
(2) The market is currently resting on the 786FIB. A key level in-and-of-itself, however, we also have alignment with an underlying ascending trend line (see FIB in red font)
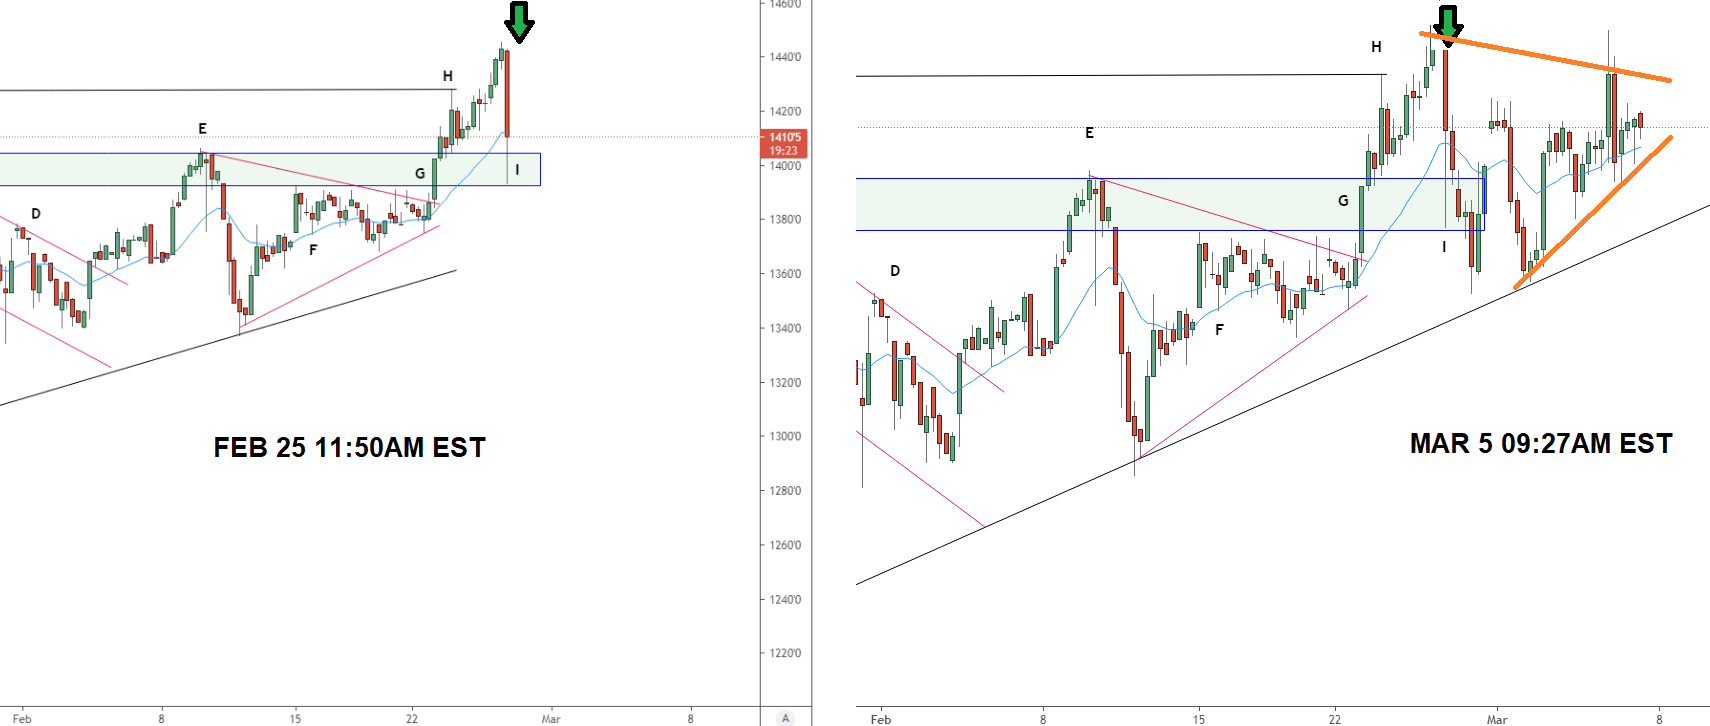
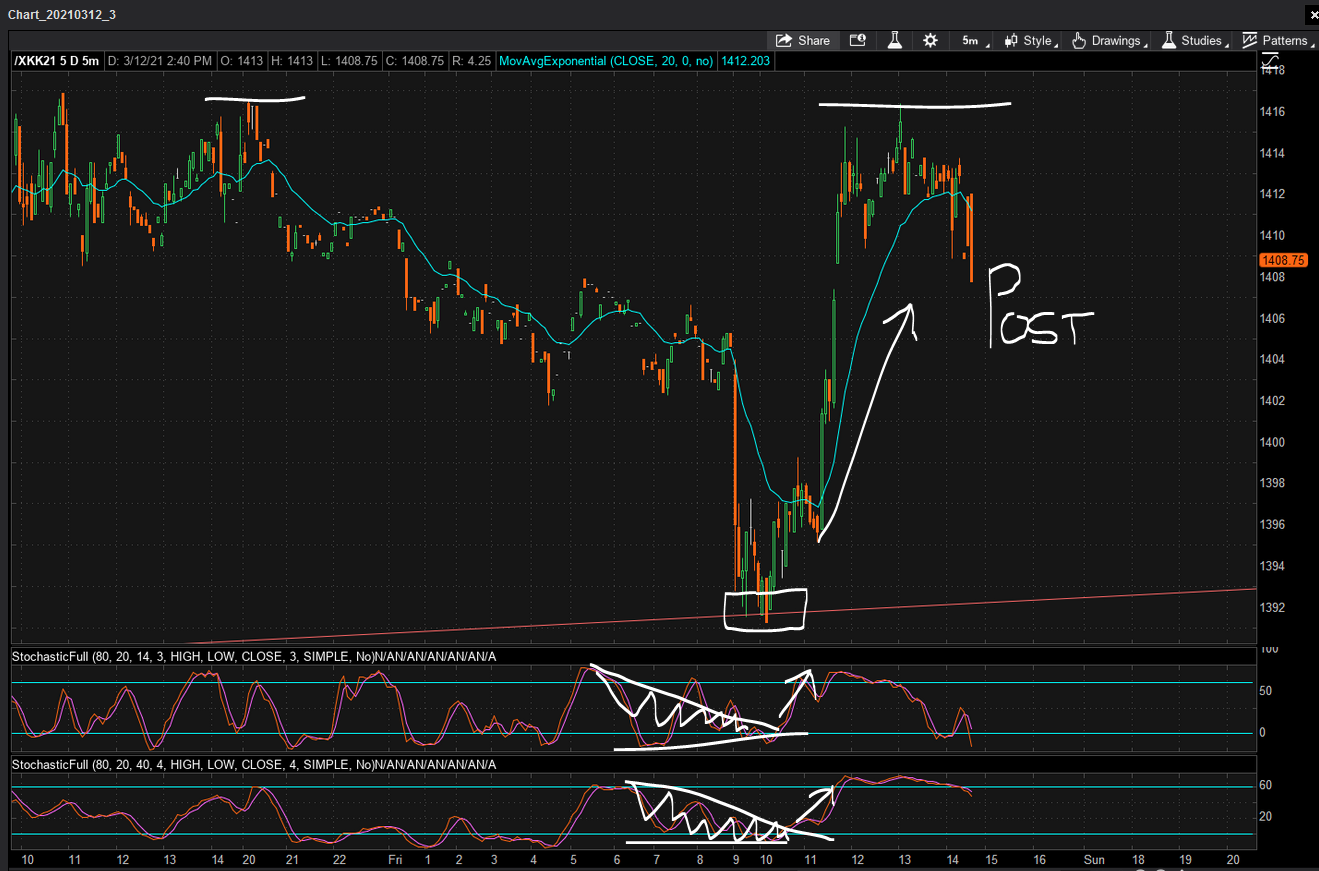
(3) From a momentum standpoint (using STOCHASTICS) ANOTHER key momentum pattern has played out. (If you remember, the prior post above this illustrated the power of the stochastic coil). This behavior is called the DUAL ROTATION. When both the fast and slow momentum indicators align and fire off either overbought or oversold conditions, traders take notice.
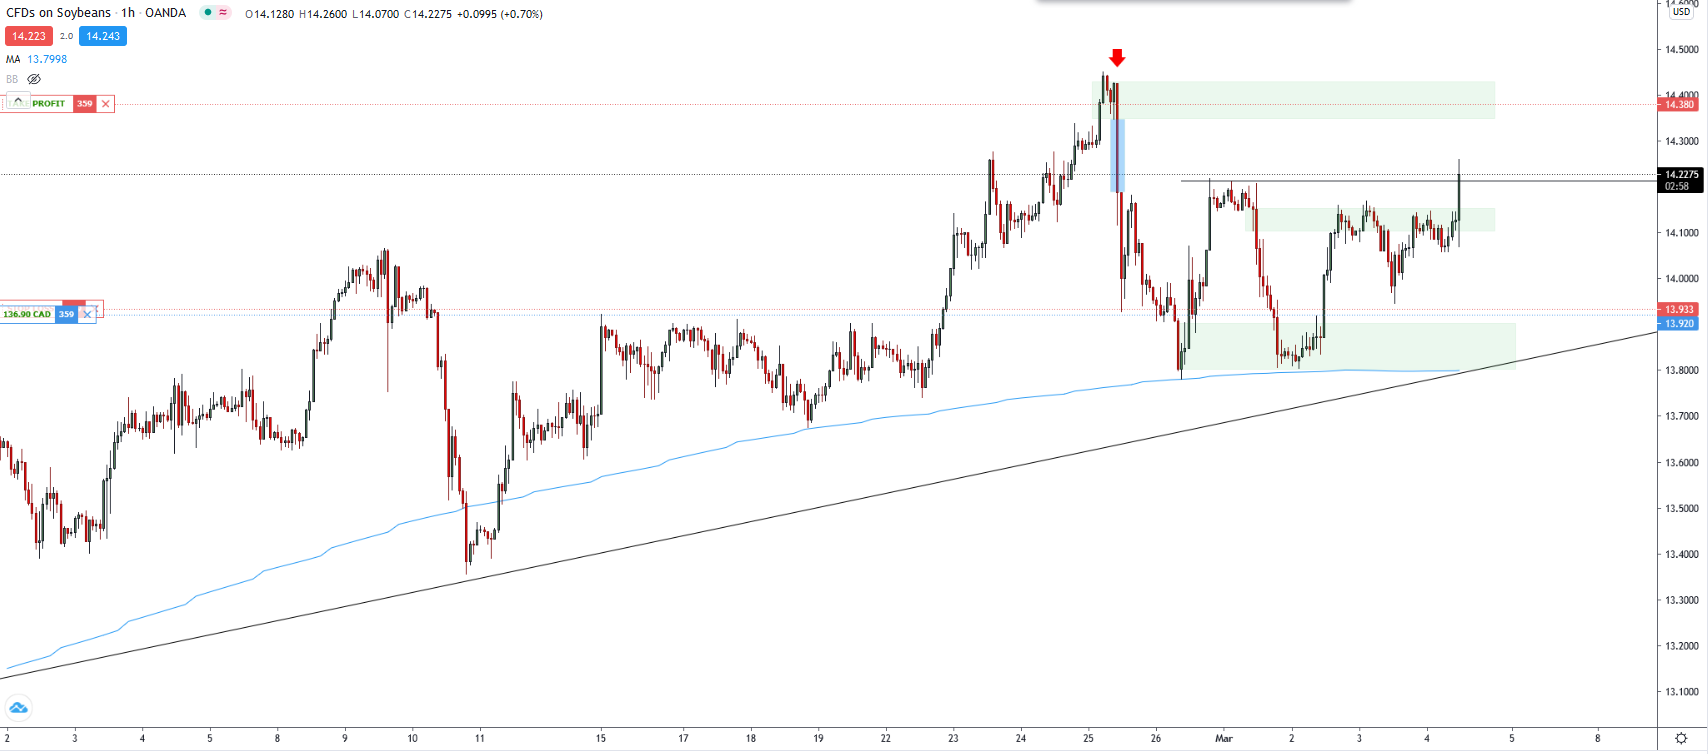
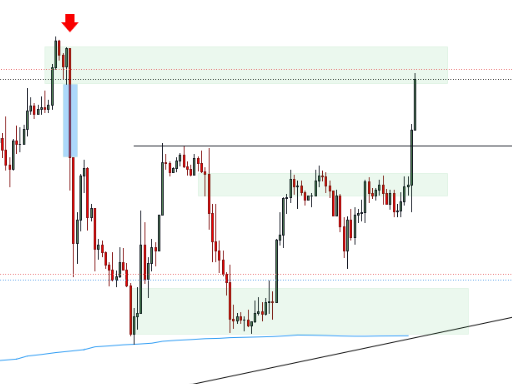
The first alignment occurred last FRI, you can see the two white boxes, joined by an arrow, and the market bottoming at the LOW position. During that trading session, both stochastic indicators were heavily oversold and presented a good buying opportunity. THIS IS KEY: Since that first LOW point, the indicators completed a FULL ROTATION from oversold, to overbought, and then back to oversold - WITHOUT coming back down into oversold territory. That information taken in isolation is semi-powerful, but can be enhanced. THIS IS CRITICAL The market did NOT PRINT A NEW LOW, OR TEST THE PRIOR LOWS. This dual rotation and price action divergence is indicative of underlying buy-side strength. If momentum rotated from OS, to OB, and then back to OS and printed new lows- that would indicate that underlying order flow was stronger on the sell side and momentum is fading.
(4) Focusing in on the PINK text, we can see a clear FAST STOCH and price action divergence. Another signal of strength for buyers. The market printed a higher low, but you can see that price actually moved lower while the underlying momentum rotated higher. This means that relatively speaking, the last 2-3 sessions saw lower prices, but, candles were closing higher / closer toward the highs of the individual candles.
The dual rotation, into the FIB, into the ascending trendline / triangle base, w/ the momentum divergence indicate what many analysts are labeling as profit taking, or simply positioning prior to the most important AG report of the year (released WED).
I’ll take it a step further and provide some analysis of the derivative space for the big contract (SOYBEANS /ZS).
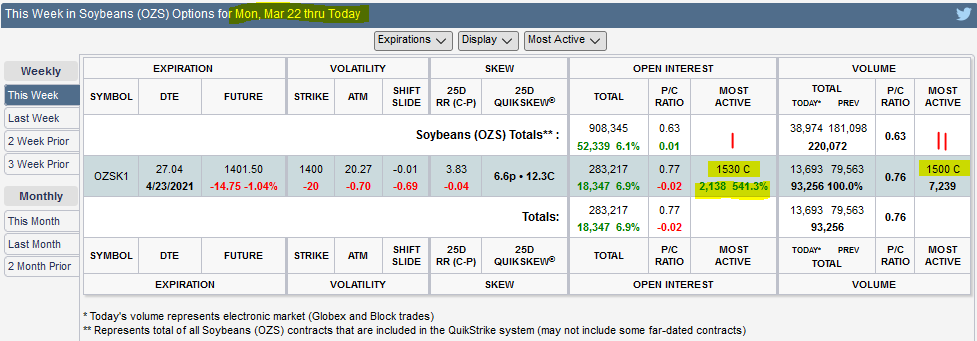
Option activity for the week ending Mar 16.
(1) Most active strike (open interest) was the 1530 call- an additional 2k contracts added
(2) Most active strike (volume) was the 1500 call- 7k contracts traded
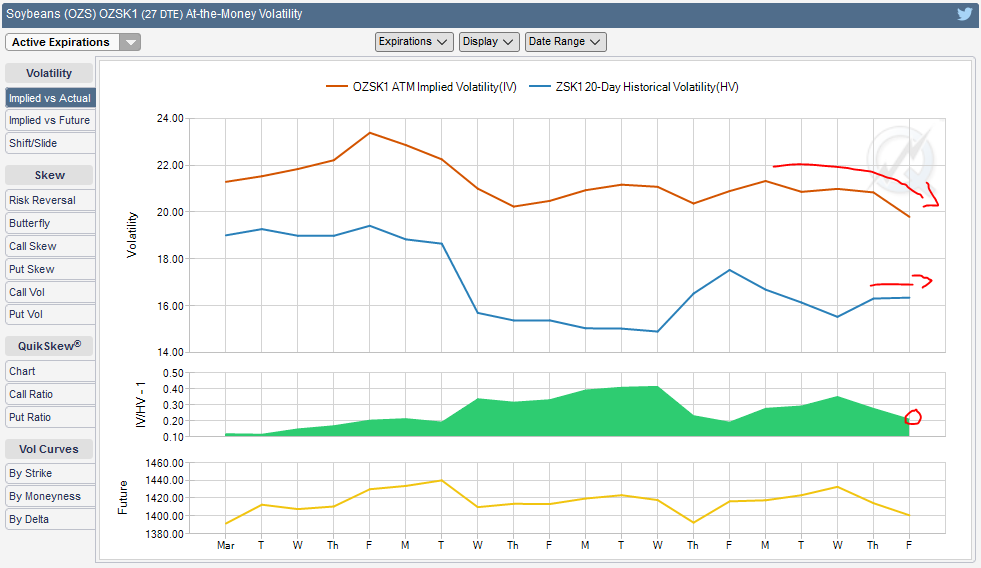
At the money volatility analysis
Even with the pending USDA report on WED, ATM implied volatility is actually going down…this is kind of odd to me, as I would have expected VOL to increase prior to the release, and then crush after (VOL CRUSH). However, maybe the real signal here is that historical vol (or actual vol) is basing after increasing. So, it seems like some juice is coming out of option premiums ATM, but the realized vol is not understated and trading closer to implied vol.
You can see the ratio (2nd chart / green area) has been decreasing as well, which support my prior sentence. IV is coming down, HV is increasing- the market is getting ancy and ready to make a move.
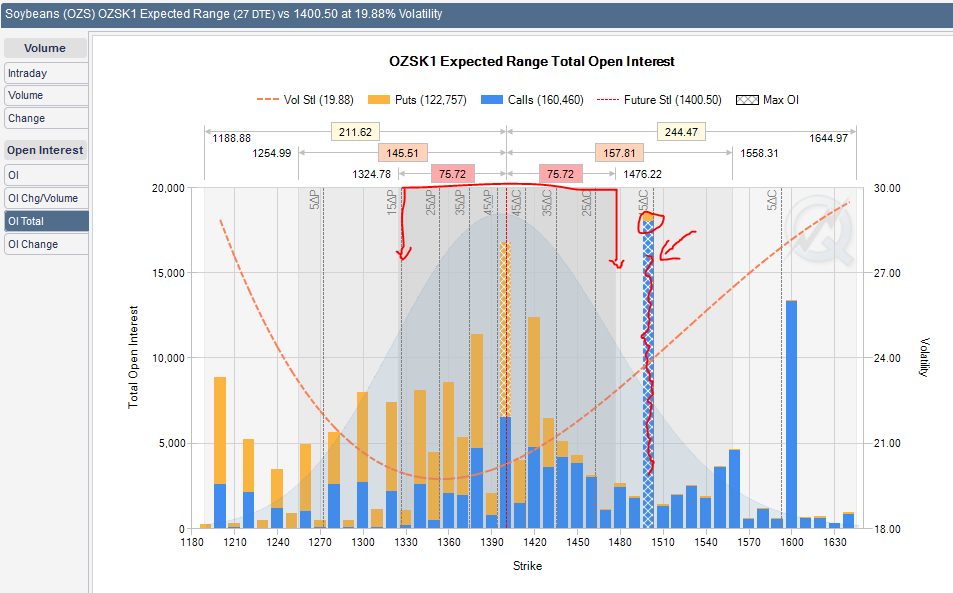
Expected range based on VOL
The 1 STD DEV move is +/- 75 points. This is plotted against total OPEN INTEREST and boom- you should see it instantly. The big bar @ 1500 is nearly 19k open contracts. I’ve confirmed that this is the most open interest on a single strike for BEANS in history. This is a big deal. Even moreso because it is outside of the 1 STD DEV move. Traders are making significant bets that 1500 is going to be a key price level in the next 27 days!
Forgot to add, another CRITICAL element. The 1500C strike is currently the 15DELTA strike. That means the market is currently pricing in a roughly 15% chance that beans will trade at 1500 on expiration 27 days from now. There is a 30% chance that the market touches 1500 between today and expiration. A very large amount of interest and capital is currently committed to an outcome that has a 15% chance of playing out…?
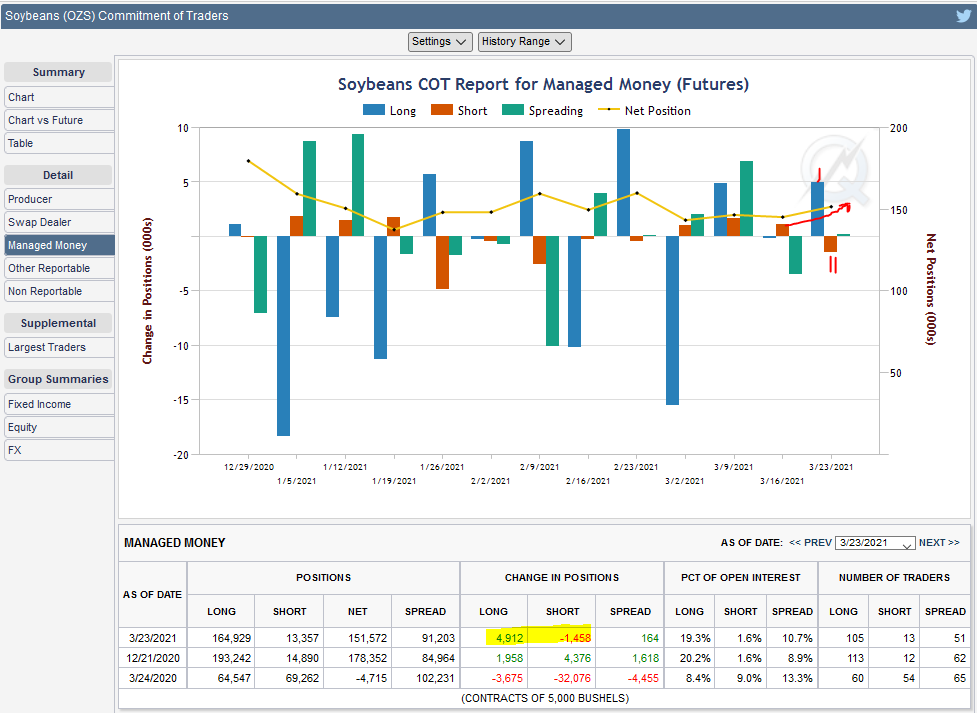
Nothing fancy here- just some COT analysis
(1) Traders getting more long and building net positions (upward arrow) as of MAR 23. The TUE MAR 30 report will give us some more insight as to what traders did ending this week- I’d imagine they’re continuing to get net long as so much activity went off on the call side around 1500 and 1530. They add 5k contracts.
(2) They took down 1.5k contracts, decreasing the short exposure.

Open interest heat map
BEANS are @ 1400
You can see the 18k open interest at 1500 on the call side. This number has been growing steadily since FEB.
Jake