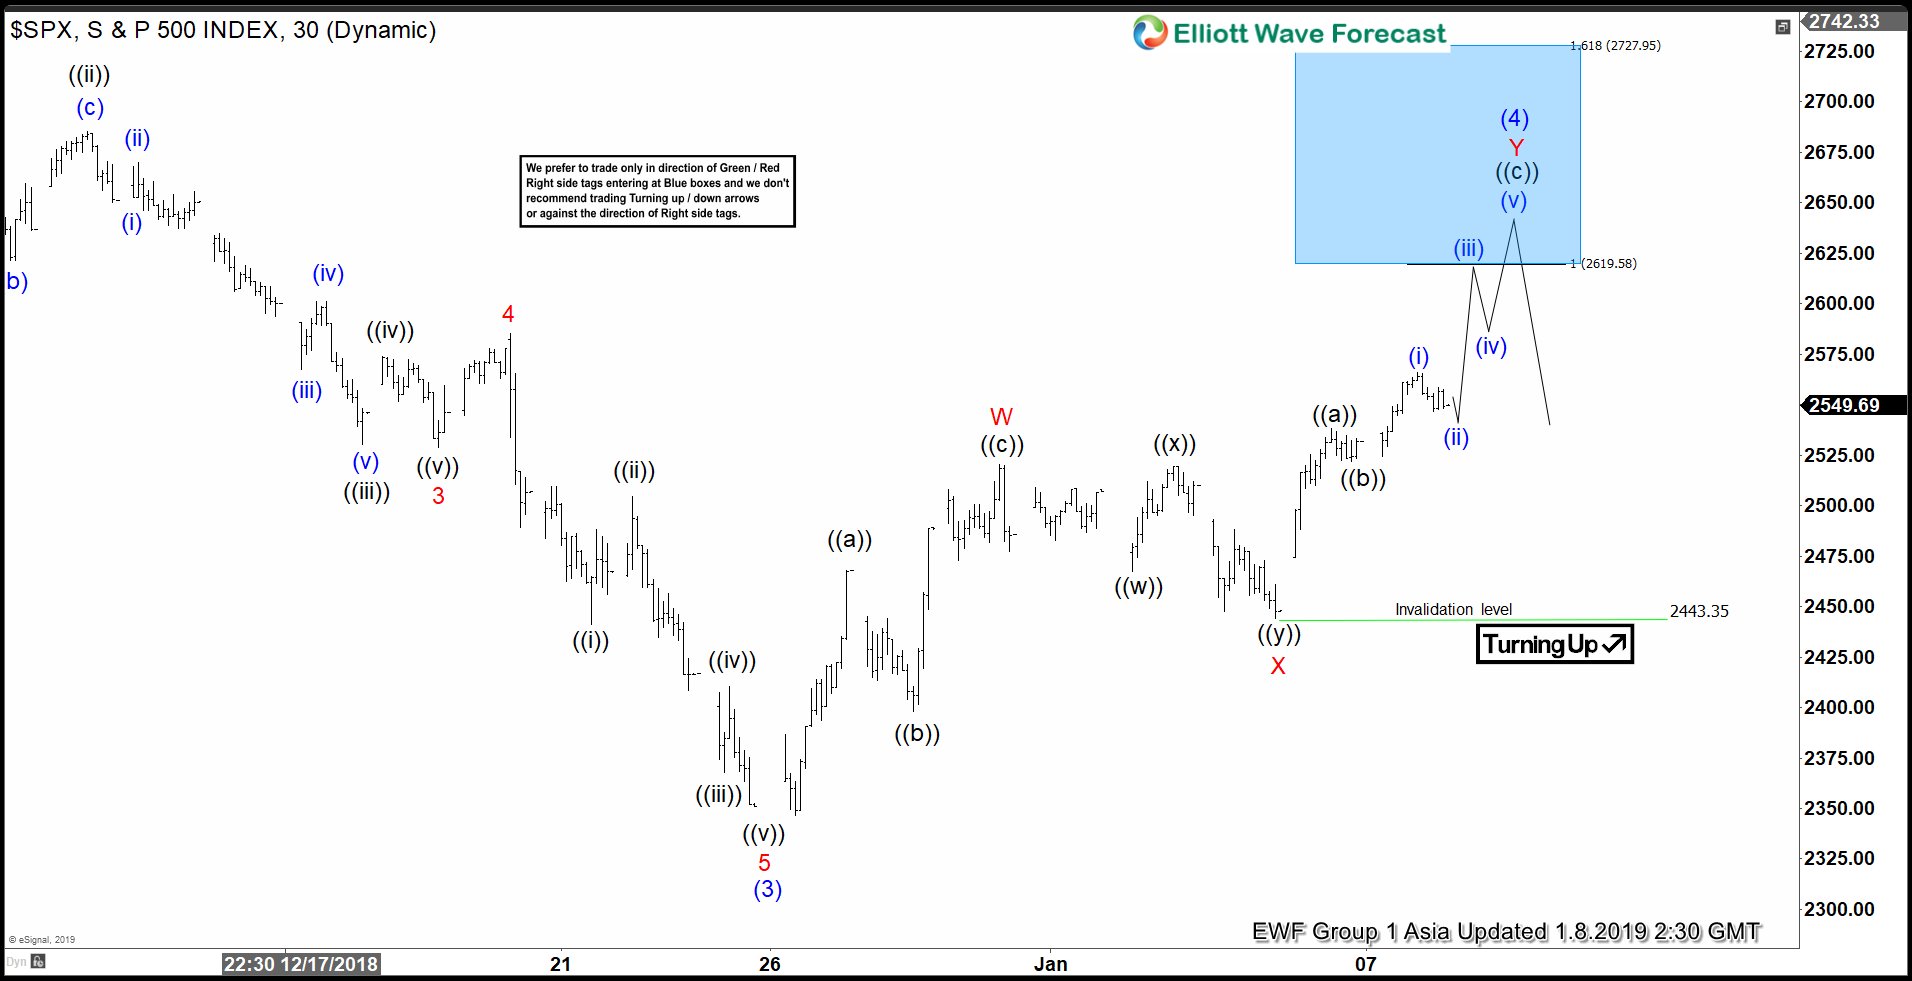
SPX has broken below Oct 30 low (2603.54), i.e. Primary wave ((W)), opening further downside with incomplete bearish sequence from Sept 21 high (2940.91). Near term Elliott Wave view suggests the decline to 2603.54 on Oct 30 low ended Primary wave ((W)). Bounce to 2815.6 ended Primary wave ((X)) as a zigzag Elliott Wave structure. Up from 2603.54, Intermediate wave (A) ended at 2756.55, Intermediate wave (B) pullback ended at 2700.44, and Intermediate wave © of ((X)) ended at 2815.62.
SPX has since declined from there and broken below Primary wave ((W)) at 2603.54, confirming the next leg lower has started. Primary wave ((Y)) is unfolding as a zigzag Elliott Wave structure where Intermediate wave (A) ended at 2583.23. Internal of Intermediate wave (A) unfolded as a diagonal where Minor wave 1 ended at 2631.09 and Minor wave 2 ended at 2800.18. Minor wave 3 ended at 2621.53, Minor wave 4 ended at 2708.54, and Minor wave 5 of (A) ended at 2583.23. Intermediate wave (B) is currently in progress to correct cycle from Nov 8 high (2815.62) in 3, 7, or 11 swing before the decline resumes. We expect Index to find sellers once Intermediate wave (B) bounce is complete in 3, 7, or 11 swing as far as pivot at 2815.62 high stays intact.
SPX 1 Hour Elliott Wave Chart

