As a general rule, I always add spread when placing any type of BUY order (including TP or SL to close a SELL order). I’m curious what Phil would say about this when calculating the TP/SL for his method (ie, what did he do in the backtest?)
Please where can I get this strategy?
Damn IGmarkets. I dont know whats going on.

Im going to adjust my trades to match everyone else figures. 
Where is a reliable place to get the high and low numbers of the Sunday candle, since my Fxpro doesn’t have it. I tried using Oanda demo too and used 4 1hr candles to take high and low but the numbers are a bit off from the ones a few posts above…
Rei,
I think your numbers are correct. Here is the 4-hour period as it appears on the 5-minute chart. (I don’t use a 4-hour chart.)
The High and Low of the period (20:00-midnight GMT) on my FXCM charts are similar to your numbers.
I am long from 1.6450 with a 190-pip TP, and 105-pip SL.
Note: the pending order on the left side of the chart is not part of this strategy.

using Go Markets, the SL is too huge, using IBFX its’ only 48 pips? hmmm
Im done for this week, both short and long positions are losers for me…
Using IBFX 48 pip range!!
Using the figures I posted above, both my GBPUSD and EURJPY trades are long and in profit. SL was moved to breakeven on the EURJPY trade.
CORRECTION: the GBPUSD hit stop and is now in the short position…
I got stopped out by 1 pip…
I wonder if in the Ea we could have a option to change the stop loss offset, because my broker sometimes changes the spread… so would be great to offset a little in order not to get stopped by 1 pip
other thing that I was lookink this strategy seems very good… I was backtesting it, olnly looking and seems really good:
I think that if we make a Ea of that strategy… it would be very simillar to the Sunday BO strategy by phil, just change some aspects of the ea :)… I think its worth a try!!
Thanks all!
I have another question…
so this week I’ve taken both the GBPUSD and EURJPY trades. Both GPBUSD trades stopped out, each with a 63-pip loss. The EURJPY long reached target of 200. So that’s a net of 74 pips.
Right now the EURJPY still has a pending short trade. Should I wait until Wednesday to cancel this? Or should I wait and see if it will whip back around?
How did ibfx only get a 48 pip range, I dont see how this could be possible unless ibfx data feed started at 2300 GMT meaning it only included the last hour of the sunday night candle.
I am interested to know if this has anything to do with daylight saving time changing at various places around the globe in the last couple of weeks & if so was Phills backtesting based on only 1 hour of sunday data during the winter months
I personally stayed out this week due to the large sunday candle meaning no BE point before reaching PT
Both long and short positions got stopped out, lost quite a bit…
By ‘quite a bit’ you mean 4%, right? 
I’m thinking I will let the EURJPY short trade trigger, which may happen today. I want to be out of the trade by Wed. before the FOMC announcement if possible.
Looking at this chart, I think EURJPY is on a minor downtrend and I will look to get out around the 130.55 support area (that would have been my breakeven point) rather than deal with any FOMC-announcement craziness…
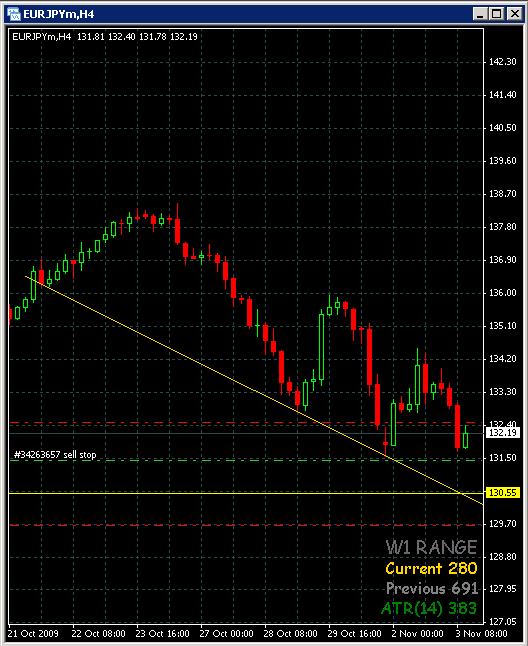
What do you think?
sorry newbie question here…how do you look at the ATR and able to calculate the TP again? you take the High candle and you add that to whatever your ATR says and that’s your TP?
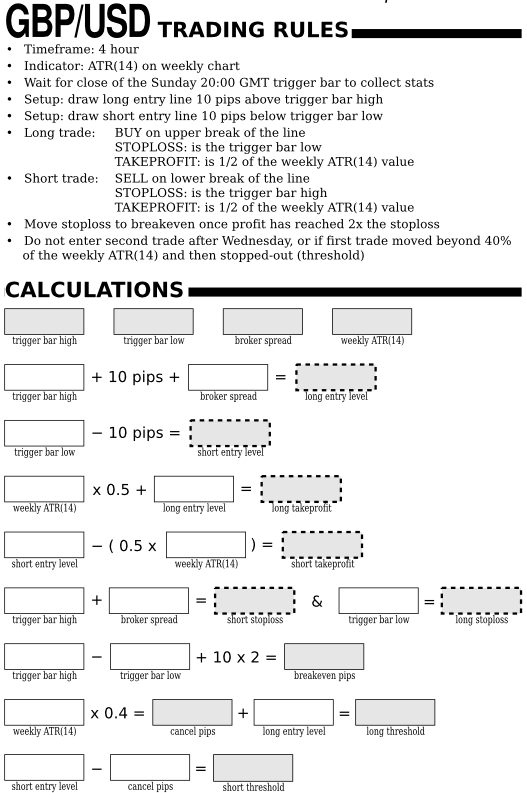
Hello, I’m working on a new concept to help me with this trading strategy. Even though strategies like this are really very “simple,” they can still require a lot of calculations and checks to make sure you execute correctly. I like to make worksheets to help me execute properly. I calculated both the GBPUSD and EURJPY trades this week by hand and it filled a half notebook page of figures!
I’d like to have a quick-and-dirty cribsheet that will help me get all the numbers needed, as well as a quick overview of the trading rules at a glance. This is still a work in progress, but tell me what you think… I’m looking for ways to make it as simple and quick as possible.
This is actually a half-landscape page, and next to it will be a similar cribsheet for the EURJPY strategy. This way you would have 1 cribsheet filled out each week for your trade records. I will upload a PDF once I get the method simplified enough (do you think this is overly complicated?)
The way it works is… .all the grey boxes are newly-calculated figures. The hollow boxes are just referring back to an already-calculated value.
PS: there could be bugs in formulas … let me know if you spot one.
That looks fine to me. I also calculate how many lots to take by dividing 2% of my account size by the size of the risk, and I have to convert to and from my base currency in AUD. But I dont bother with broker spread.
I also have an area of my spread sheet for GBP JPY with the same calculations. But I’ve decided I should only trade that if the sunday data is tiny and there is a potential for a huge profit and very quick break even.
I dunno if its a good idea or not, but it seems to me if you are trading a regular plan like this one which has position sizes based on a fix amount of risk, it would make a lot of sense to increase your account size regularly as well by depositing a part of your savings into it. It would make a huge difference. Try it for yourself, if you take Phil’s original backtest spreadsheet, and every two weeks add, say $500 into it, see what the final total is compared to without a savings plan.
Good idea – I will add this. I also want a formula to calculate Reward:Risk ratio.
But I dont bother with broker spread.
I’m on the fence with this but generally do calculate it because most strategies are at least somewhat visual based, and that is the only way to ensure what you see on the chart is what you’re actually trading. For example if you BUY on this strategy when chart is 10 pips above the trigger bar high, it’s pretty critical that you include the ~4 pip spread I think. (NOTE: if you were referring only to NOT-including spread in your lots calculation… then I would agree with that. Because you want to simplify as much as possible. I think spread calculation only important where you are referring to broker orders BUY/SELL/TAKEPROFIT/STOPLOSS)
I also have an area of my spread sheet for GBP JPY with the same calculations. But I’ve decided I should only trade that if the sunday data is tiny and there is a potential for a huge profit and very quick break even.
For now I’m going to trade both strategies and use the rule-of-thumb that Phil mentioned… which is to monitor Reward:Risk ratio and see if it remains poor for several weeks before pausing on the EURJPY strategy. It takes a lot of discipline to execute in a mechanical way.
I dunno if its a good idea or not, but it seems to me if you are trading a regular plan like this one which has position sizes based on a fix amount of risk, it would make a lot of sense to increase your account size regularly as well by depositing a part of your savings into it. It would make a huge difference. Try it for yourself, if you take Phil’s original backtest spreadsheet, and every two weeks add, say $500 into it, see what the final total is compared to without a savings plan.
I agree that is a great idea! It should definitely accelerate your profits…
so how’d you guys do this week?? I got a question, if i live in New York, at what time would the closing Sunday candle be for me? This gonna be my first time trying this
Hey aaron,
I live on Long Island.
Use the candle that closes at 8pm EST on Sunday.
Good Luck,
Michael