| Indicator | Value | Signal |
|---|---|---|
| RSI | Buy | |
| MACD | Buy | |
| Parabolic SAR | Buy | |
| Fractals | Buy | |
| MA(200) | Neutral | |
| Bollinger Bands | Neutral |
Chart Analysis
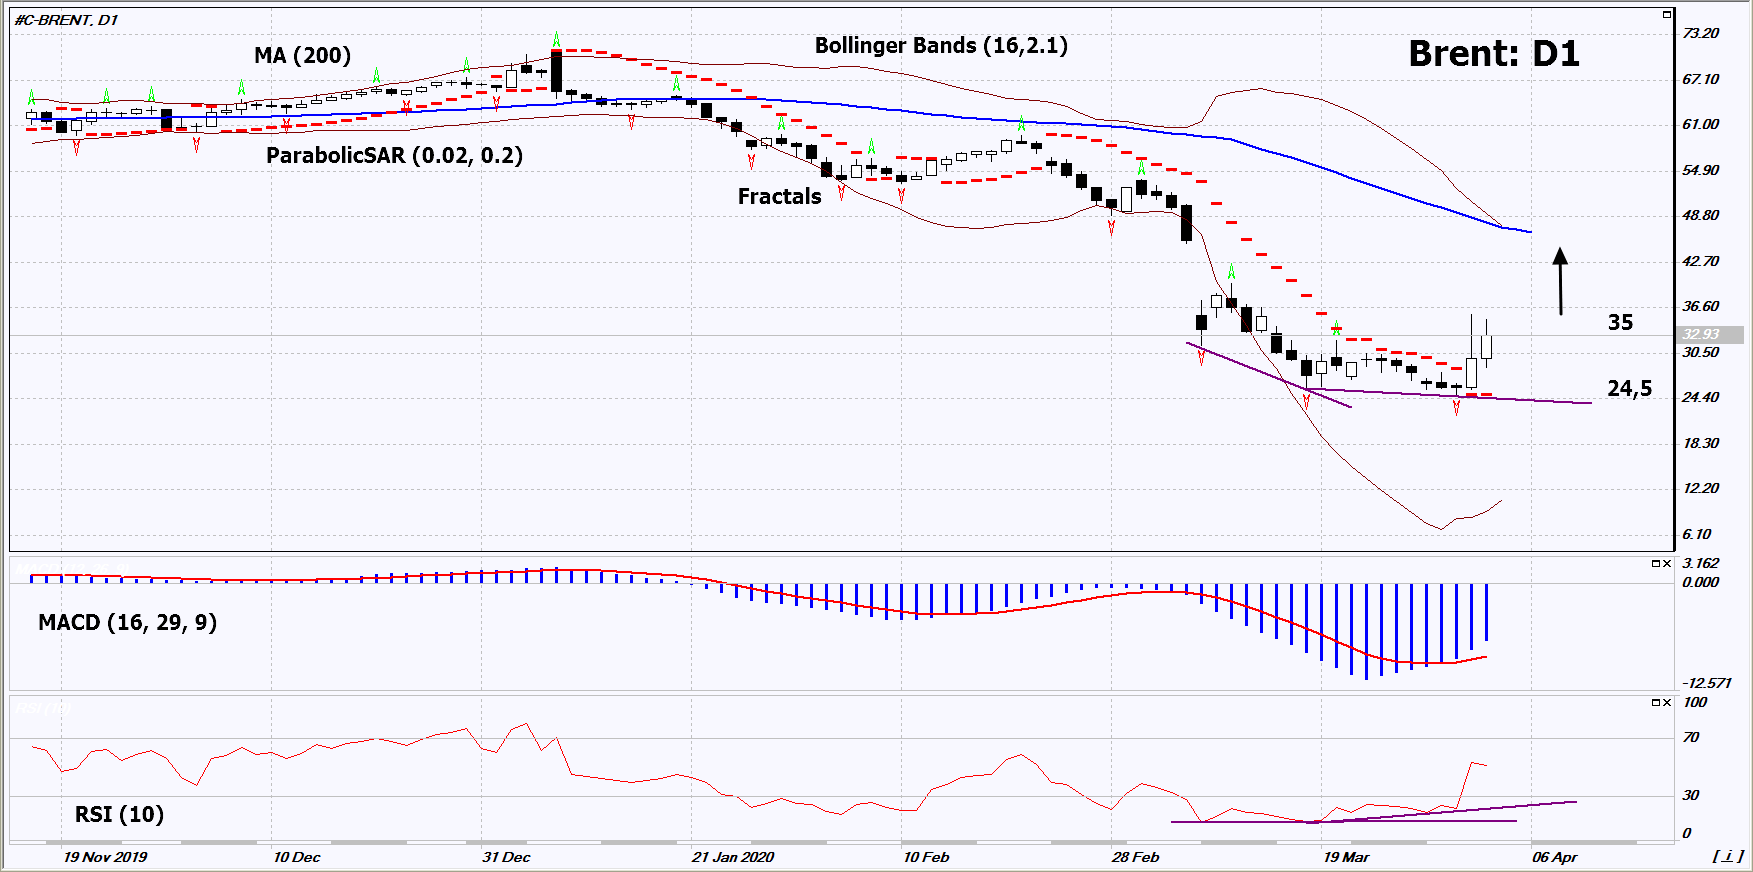
On the daily timeframe, Brent: D1 is trying to correct upward after a powerful decline. A number of indicators of technical analysis formed signals for a further increase. We do not rule out a bullish movement if Brent rises above its last maximum and psychological level: 35. This level can be used as an entry point. The stop loss is possible below the last lower fractal, the lower limit of the neutral range, the 18-year minimum and the Parabolic signal: 24.5. After opening the pending order, we move the stop loss following the signals of Bollinger and Parabolic to the next fractal minimum. Thus, we change the potential profit / loss ratio in our favor. After the transaction, the most risk-averse traders can switch to a four-hour chart and set a stop loss, moving it in the direction of trend. If the price overcomes the stop level (24.5) without activating the order (35), it is recommended to delete the order: market sustains internal changes not taken into account.
Fundamental Analysis
On April 6, 2020, an extraordinary OPEC + meeting is to be held to limit the oil production. Will Brent quotes grow?