| Indicator | Value | Signal |
|---|---|---|
| RSI | Buy | |
| MACD | Sell | |
| MA(200) | Neutral | |
| Fractals | Buy | |
| Parabolic SAR | Buy | |
| Bollinger Bands | Neutral |
Chart Analysis
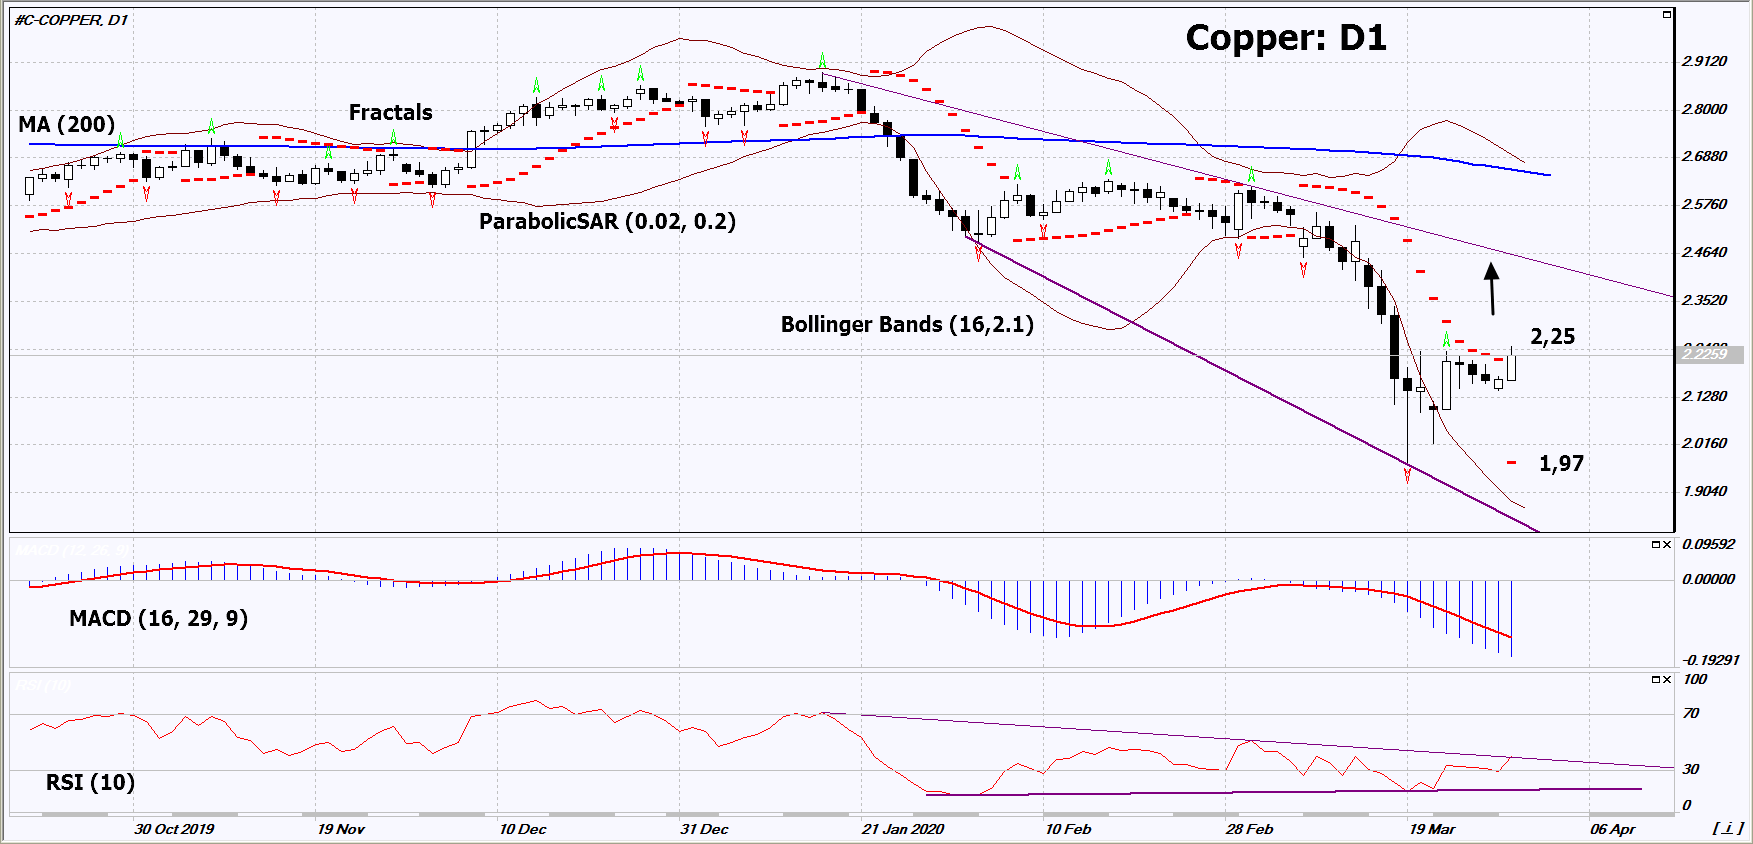
On the daily timeframe, Copper: D1 is trying to grow from its minimum in January 2016. It still remains in the medium-term downtrend, but the decline stopped and a number of technical analysis indicators generated signals for growth. We do not exclude a bullish movement if Copper rises above its last upper fractal and last maximum: 2.25. This level can be used as an entry point. The initial stop loss is possible below the Parabolic signal, the last lower fractal and the minimum since January 2016: 1.97. After opening the pending order, we move the stop loss after the Bollinger and Parabolic signals to the next fractal minimum. Thus, we change the potential profit / loss ratio in our favor. After the transaction, the most risk-averse traders can switch to a four-hour chart and set a stop loss, moving it in the direction of the trend. If the price overcomes the stop level (1.97) without activating the order (2.25), it is recommended to delete the order: some internal changes in the market weren’t taken into account.
Fundamental Analysis
China demonstrated an unexpected increase in business activity in industry in March 2020. Will Copper prices grow?