Recommendation for Corn : Buy
Buy Stop : Above 333
Stop Loss : Below 307
| Indicator | Value | Signal |
|---|---|---|
| RSI | Neutral | |
| MACD | Buy | |
| MA(200) | Neutral | |
| Fractals | Neutral | |
| Parabolic SAR | Buy | |
| Bollinger Bands | Buy |
Chart Analysis
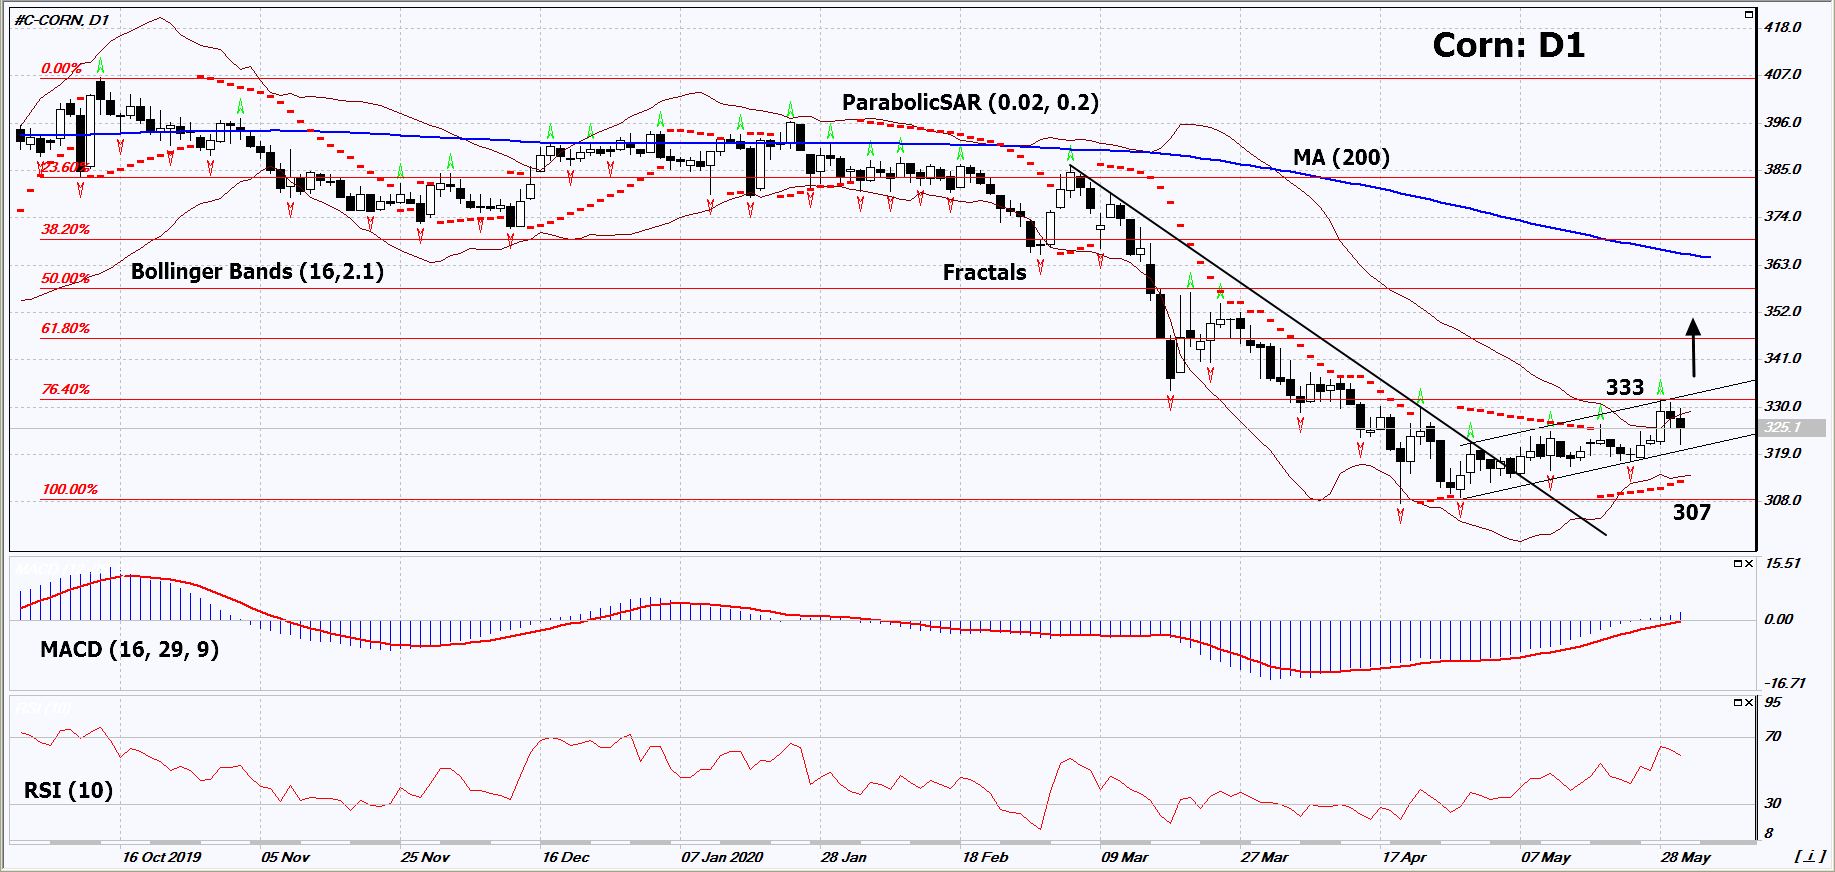
On the daily timeframe, Corn: D1 beached up the resistance line of the short-term downtrend. Now it is in a growing channel, correcting upward from the minimum since 2009 and has reached the 1st Fibonacci level. A number of indicators of technical analysis formed signals for a further increase. We do not exclude a bullish movement if Corn rises above the last upper fractal, the upper Bollinger line and the 1st Fibonacci level: 333. This level can be used as an entry point. We can set a stop loss below the Parabolic signal, the lower Bollinger line and the minimum since 2009: 307. After opening a pending order, the stop loss should be moved following the Bollinger and Parabolic signals to the next fractal minimum. Thus, we change the potential profit / loss ratio in our favor. After the transaction, the most risk-averse traders can switch to a four-hour chart and set a stop loss, moving it in the direction of the trend. If the price meets the stop loss level (307) without activating the order (333), it is recommended to delete the order: the market sustains internal changes not taken into account.
Fundamental Analysis
The decline in the water level of the Parana River due to drought may reduce corn yields in Argentina and Paraguay. This was reported by the Brazilian trader AgriBrasil. Will Corn quotes grow ?