| Indicator | Value | Signal |
|---|---|---|
| RSI | Buy | |
| MACD | Neutral | |
| MA(200) | Neutral | |
| Fractals | Neutral | |
| Parabolic SAR | Buy | |
| Bollinger Bands | Neutral |
Chart Analysis
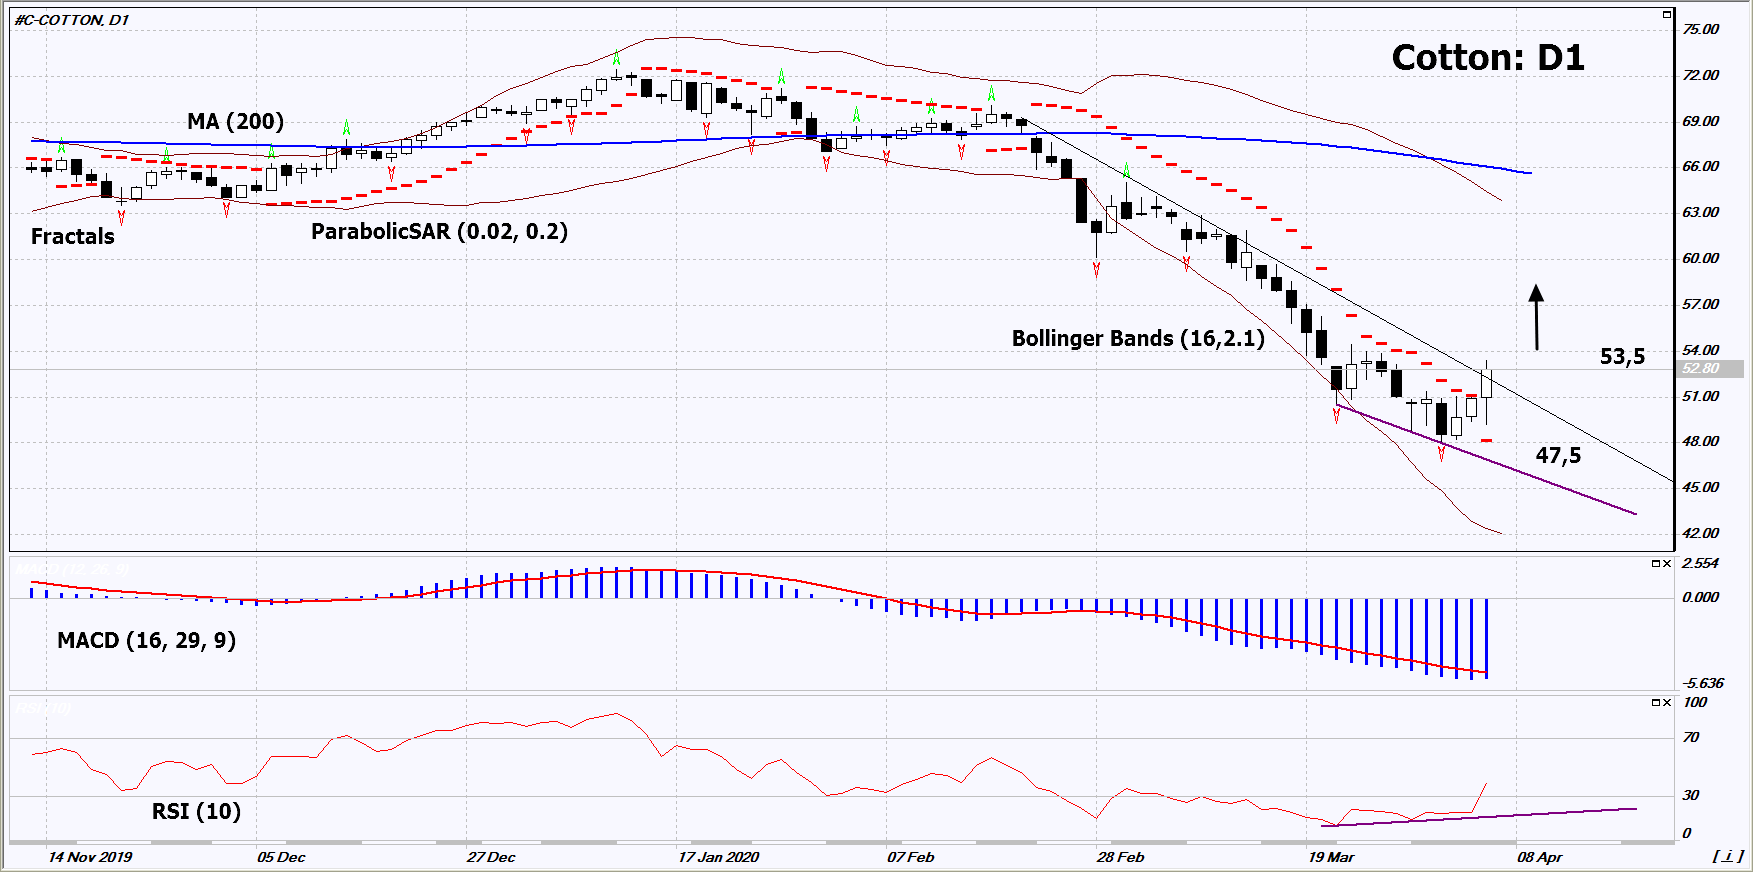
On the daily timeframe, Cotton: D1 broke above the support line for the short-term downtrend. Now it is correcting upwards from the minimum since 2009. A number of indicators of technical analysis formed signals for the further increase. We do not exclude a bullish movement if Cotton rises above its last maximum: 53.5. This level can be used as an entry point. Stop loss is possible below the Parabolic signal, the last lower fractal and the 11-year low: 47.5. After opening the pending order, the we move the stop loss after the signals of Bollinger and Parabolic to the next fractal minimum. Thus, we change the potential profit / loss ratio in our favor. After the transaction, the most risk-averse traders can switch to a four-hour chart and set a stop loss, moving it in the direction of movement. If the price overcomes the stop level (47.5) without activating the order (53.5), it is recommended to delete the order: some internal changes in the market have not been taken into account.
Fundamental Analysis
The USDA predicts a decrease in cotton yields in India. Will Cotton quotes rise?