| Indicator | Value | Signal |
|---|---|---|
| RSI | Buy | |
| MACD | Buy | |
| MA(200) | Neutral | |
| Fractals | Neutral | |
| Parabolic SAR | Buy | |
| Bollinger Bands | Sell |
Chart Analysis
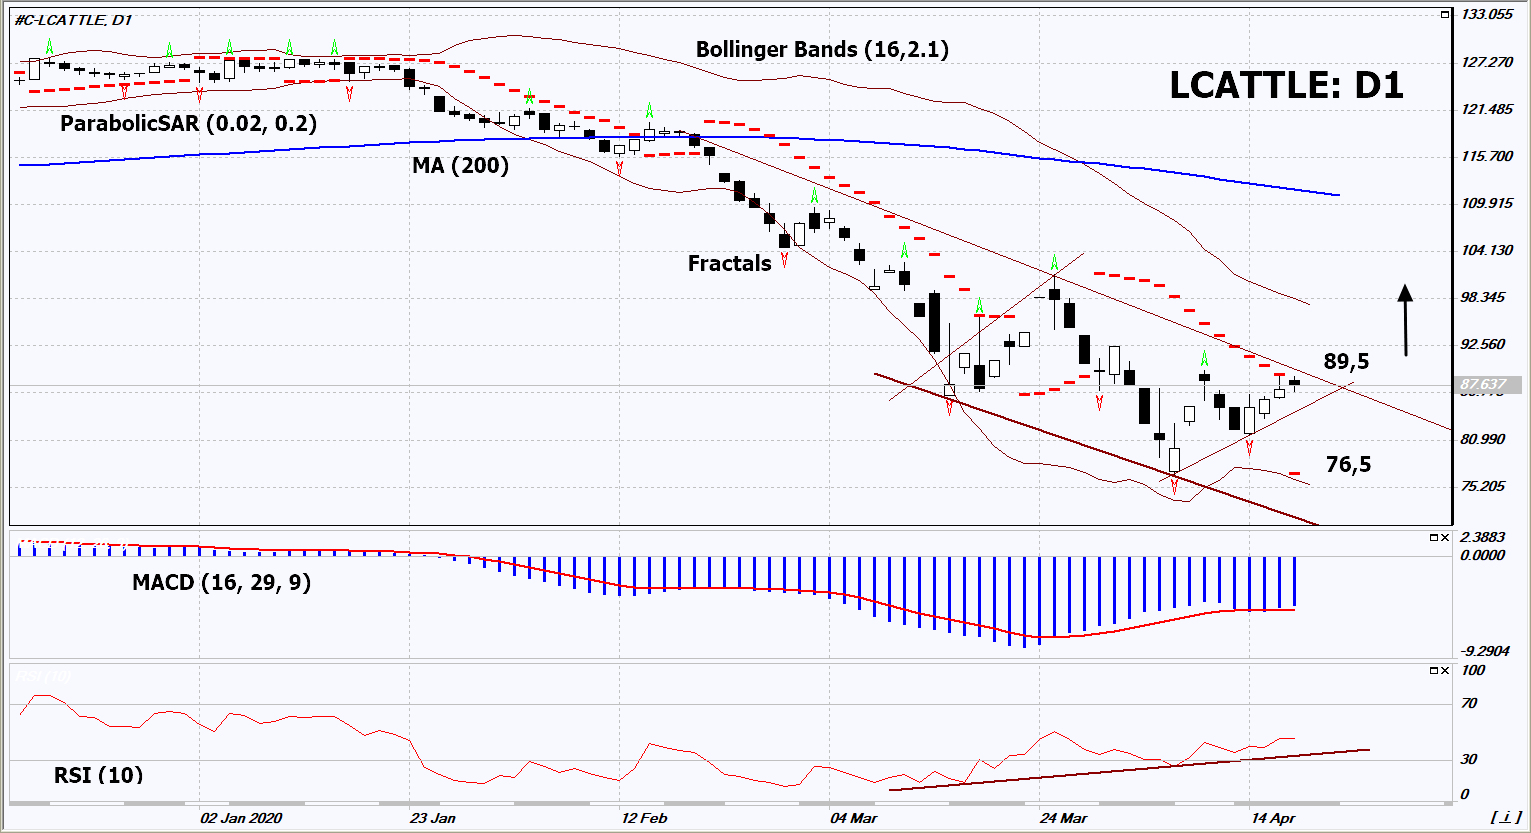
On the daily timeframe, LCATTLE: D1 formed the “Diamond” graphical price pattern. It may be a signal of a downtrend reversal. The right border of the “Diamond” pattern matches with the resistance line of the downtrend. It must be broken upwards before a buy position has been open. A number of technical analysis indicators formed signals for a further increase. We do not exclude the bullish movement if LCATTLE rises above the last upper fractal: 89.5. This level can be used as an entry point. The first stop loss is possible below the Parabolic signal, the last two lower fractals and the minimum since May 2006: 76.5. After opening the pending order, we move the stop loss following the Bollinger and Parabolic signals to the next fractal minimum. Thus, we change the potential profit / loss ratio in our favor. After the transaction, the most risk-averse traders can switch to a four-hour chart and set a stop loss, moving it in the direction of the trend. If the price overcomes the stop level (76.5) without activating the order (89.5), it is recommended to delete the order: market sustains internal changes that have not been taken into account.
Fundamental Analysis
According to the United States Department of Agriculture (USDA), the cattle slaughter in the US decreased by 23% this week compared to the same week last year and amounted to 376 thousand heads. Will LCATTLE quotes grow?