| Indicator | Value | Signal |
|---|---|---|
| RSI | Buy | |
| MACD | Buy | |
| MA(200) | Neutral | |
| Fractals | Neutral | |
| Parabolic SAR | Sell | |
| Bollinger Bands | Neutral |
Chart Analysis
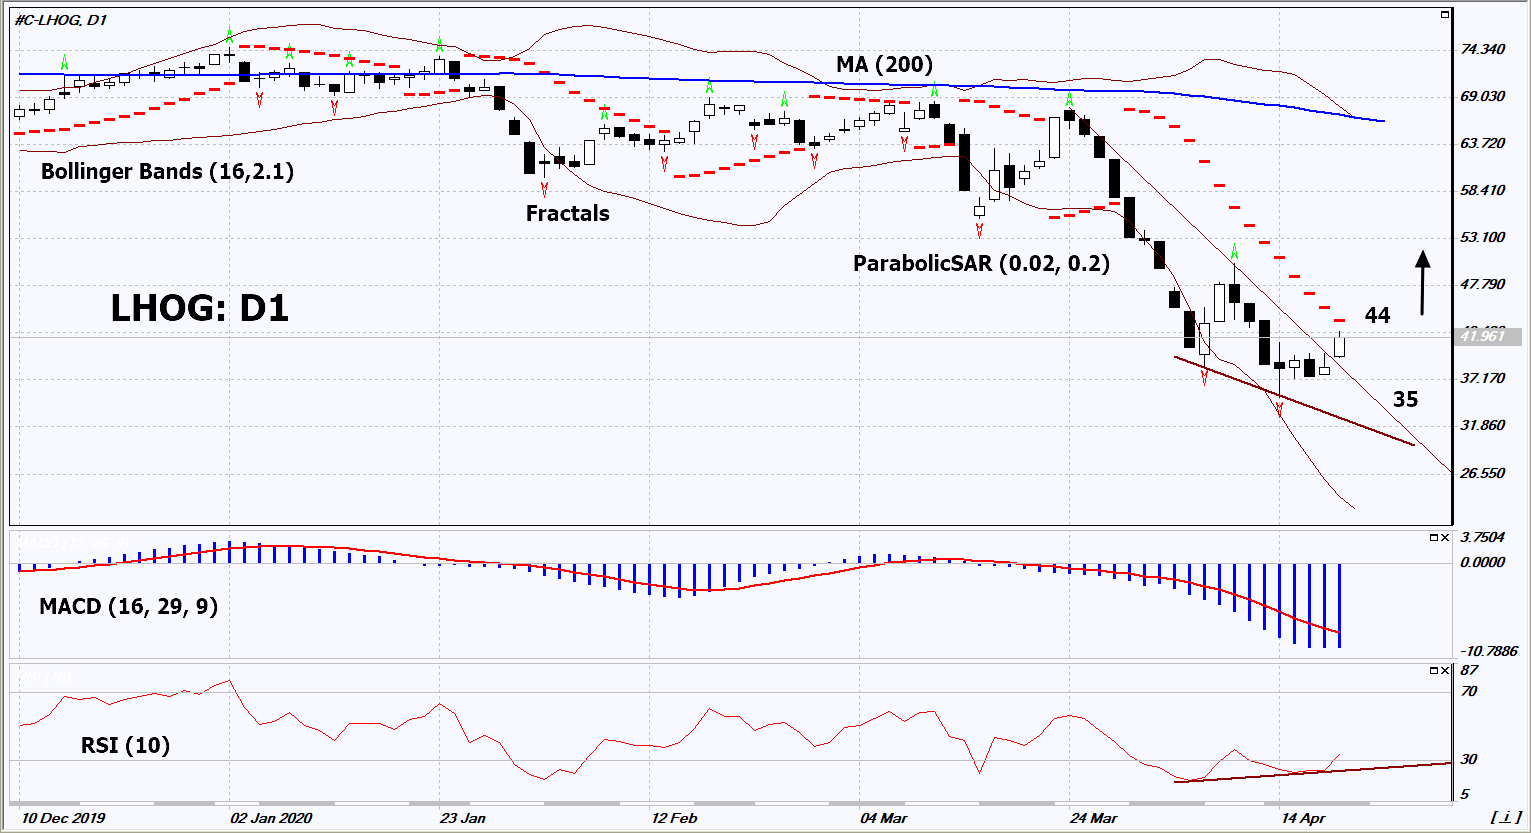
On the daily timeframe, LHOG: D1 went up from the “Triangle” graphical price pattern and at the same time from the downtrend, since the upper border of the triangle coincided with its resistance line. A range of indicators of technical analysis formed signals for a further increase. We do not exclude bullish movement if LHOG rises above the Parabolic signal: 44. This level can be used as an entry point. You can set a stop loss below the last lower fractal and minimum since 2002: 35. Note that the historical minimum was in November 1998 (28.5). After opening the pending order, we move the stop loss following the Bollinger and Parabolic signals to the next fractal minimum. Thus, we change the potential profit / loss ratio in our favor. After the transaction, the most risk-averse traders can switch to a four-hour chart and set a stop loss, moving it in the direction of the trend. If the price meets the stop level (35) without activating the order (44), it is recommended to delete the order: some internal changes in the market were not taken into account.
Fundamental Analysis
One of the largest American slaughterhouses, JBS USA, announced on Monday the closing of its pig farm in Worthington, Minnesota, for undefined period. Will LHOG quotes grow?