| Indicator | Value | Signal |
|---|---|---|
| RSI | Sell | |
| MACD | Buy | |
| MA(200) | Neutral | |
| Fractals | Neutral | |
| Parabolic SAR | Sell | |
| Bollinger Bands | Buy |
Chart Analysis
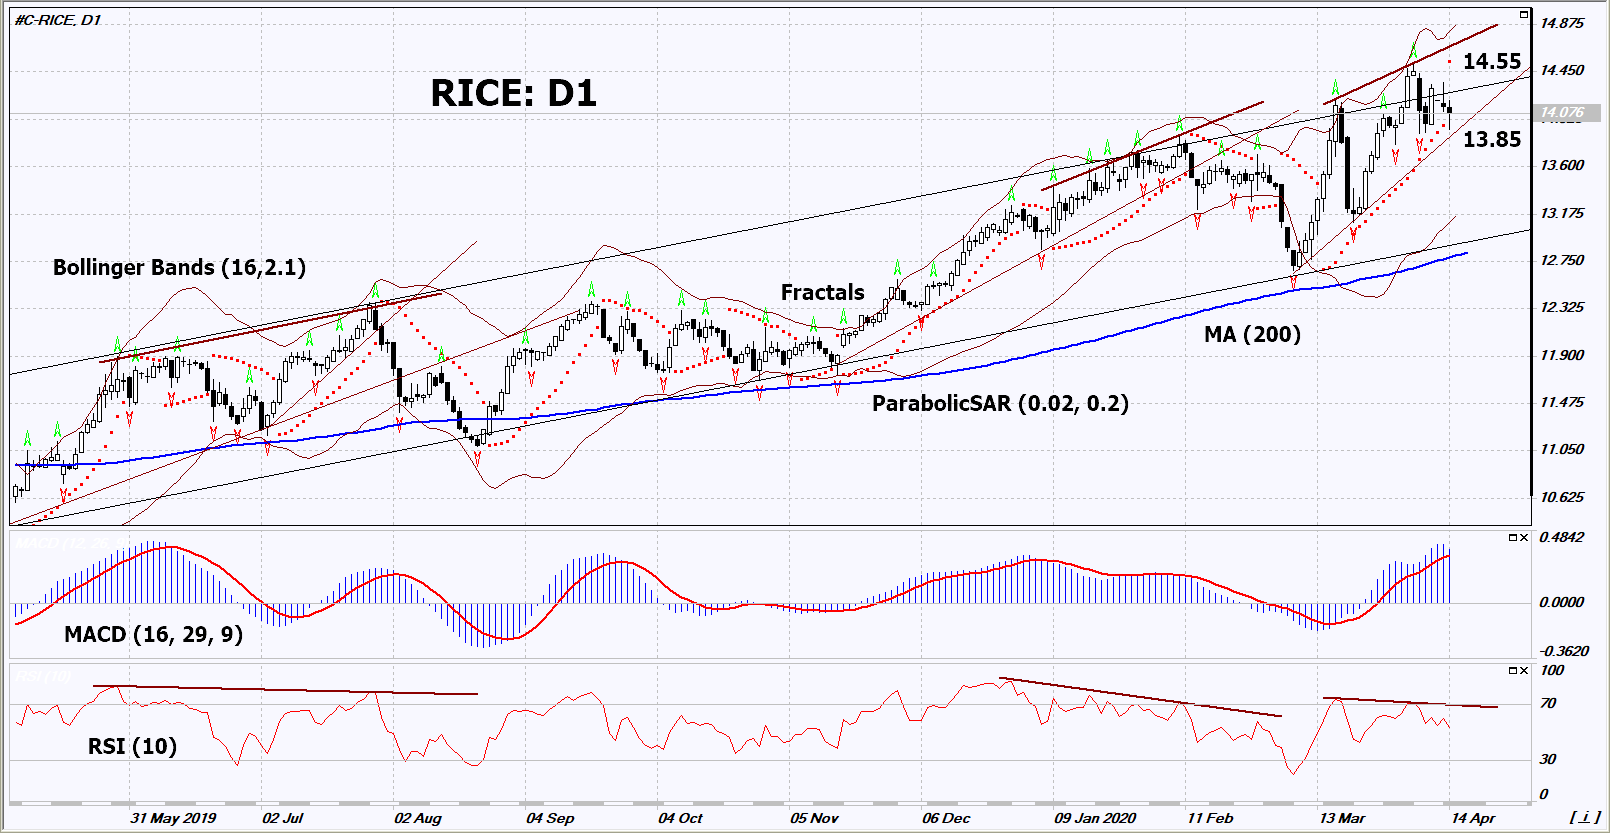
On the daily timeframe, RICE: D1 is in a short-term uptrend. It approached the upper limit of a long-term growing channel. The growth rate slowed down and a number of technical analysis indicators formed signals for a decline. There is a possibility of a downward correction to the lower boundary of the channel. We do not exclude a bearish movement if RICE falls below the last two fractals: 13.8. This level can be used as an entry point. The first stop loss is possible above the Parabolic signal, the last upper fractal and the maximum since July 2014: 14.55. After opening the pending order, we move the stop loss after the Bollinger and Parabolic signals to the next fractal maximum. Thus, we change the potential profit / loss ratio in our favor. After the transaction, the most risk-averse traders can switch to a four-hour chart and set a stop loss, moving it in the direction of the trend. If the price overcomes the stop level (14.55) without activating the order (13.8), it is recommended to delete the order: some internal changes in the market haven not been taken into accounat.
Fundamental Analysis
The Bangladeshi government is allocating $ 1.7 billion to help farmers affected by the coronavirus pandemic. Will RICE quotes decrease ?