Recommendation for Soybean: Strong Buy
Buy Stop : Above 855
Stop Loss : Below 815
| Indicator | Value | Signal |
|---|---|---|
| RSI | Buy | |
| MACD | Buy | |
| MA(200) | Neutral | |
| Fractals | Neutral | |
| Parabolic SAR | Buy | |
| Bollinger Bands | Neutral |
Chart Analysis
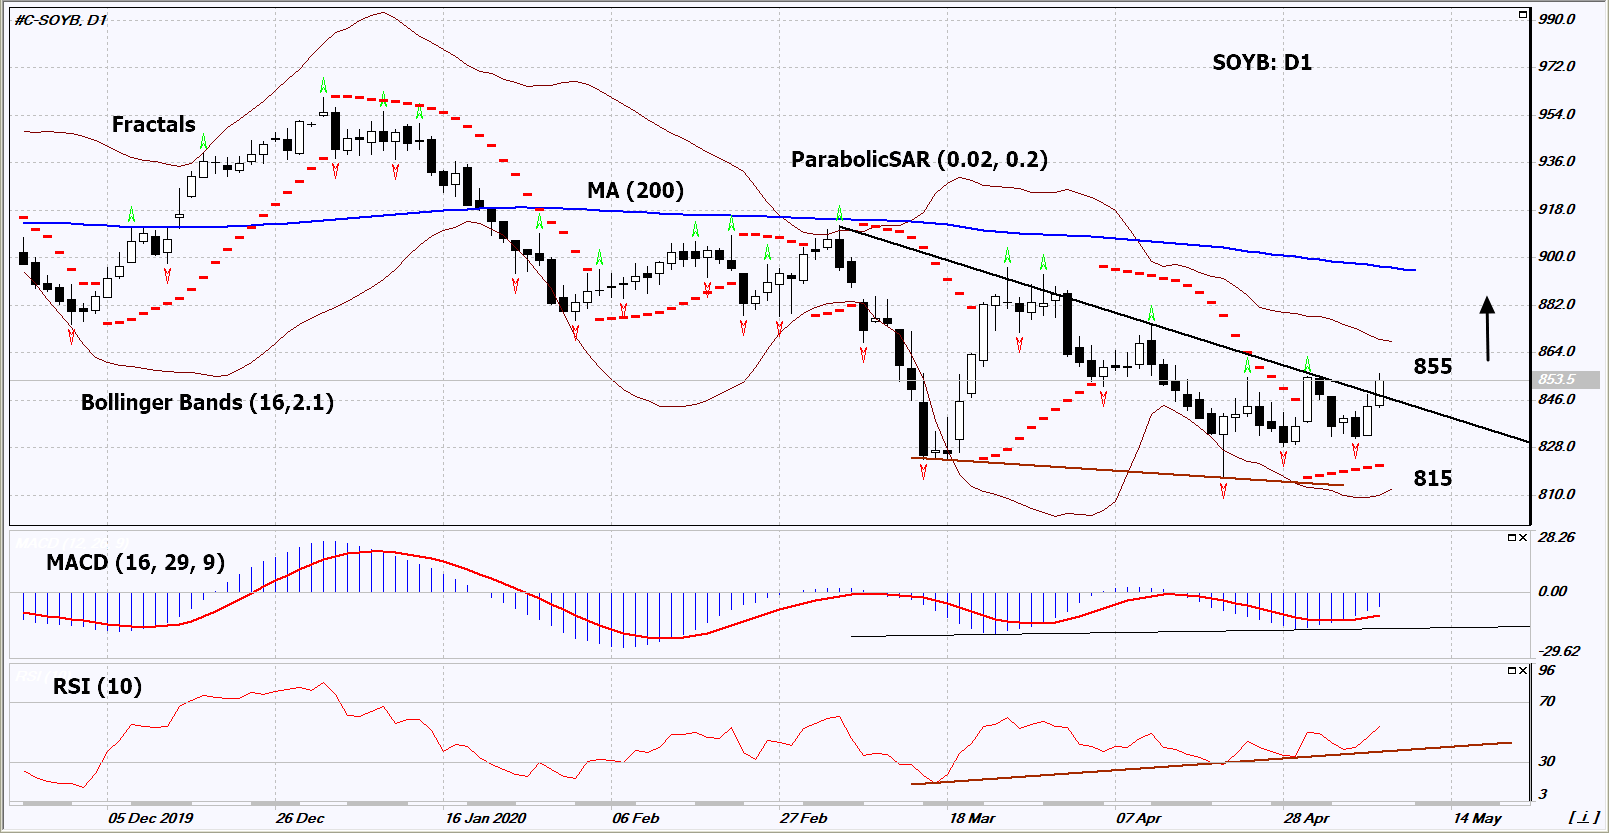
On the daily timeframe, SOYB: D1 breached up the border of the triangle, which matches with the resistance line of the downtrend. A number of indicators of technical analysis formed signals for a further increase. We do not exclude a bullish movement if SOYB rises above the last upper fractal: 855. This level can be used as an entry point. We can set a stop loss below the Parabolic signal, the annual minimum, the lower Bollinger line and the last 4 lower fractals: 815. After the pending order is opened, we move the stop loss following the Bollinger and Parabolic signals to the next fractal minimum. Thus, we change the potential profit / loss ratio in our favor. After the transaction, the most risk-averse traders can switch to a four-hour chart and set a stop loss, moving it in the direction of the trend. If the price meets the stop level (815) without activating the order (855), it is recommended to delete the order: some internal changes in the market have not been taken into account.
Fundamental Analysis
The Government of Argentina intends to increase export duties on soy, livestock feed (soy meal) and soybean oil by one third . Will SOYB quotes grow ?