Recommendation for USD/JPY: Strong Buy
Buy Stop : Above 107.5
Stop Loss : Below 105.7
| Indicator | Value | Signal |
|---|---|---|
| RSI | Buy | |
| MACD | Neutral | |
| MA(200) | Neutral | |
| Fractals | Buy | |
| Parabolic SAR | Buy | |
| Bollinger Bands | Buy |
Chart Analysis
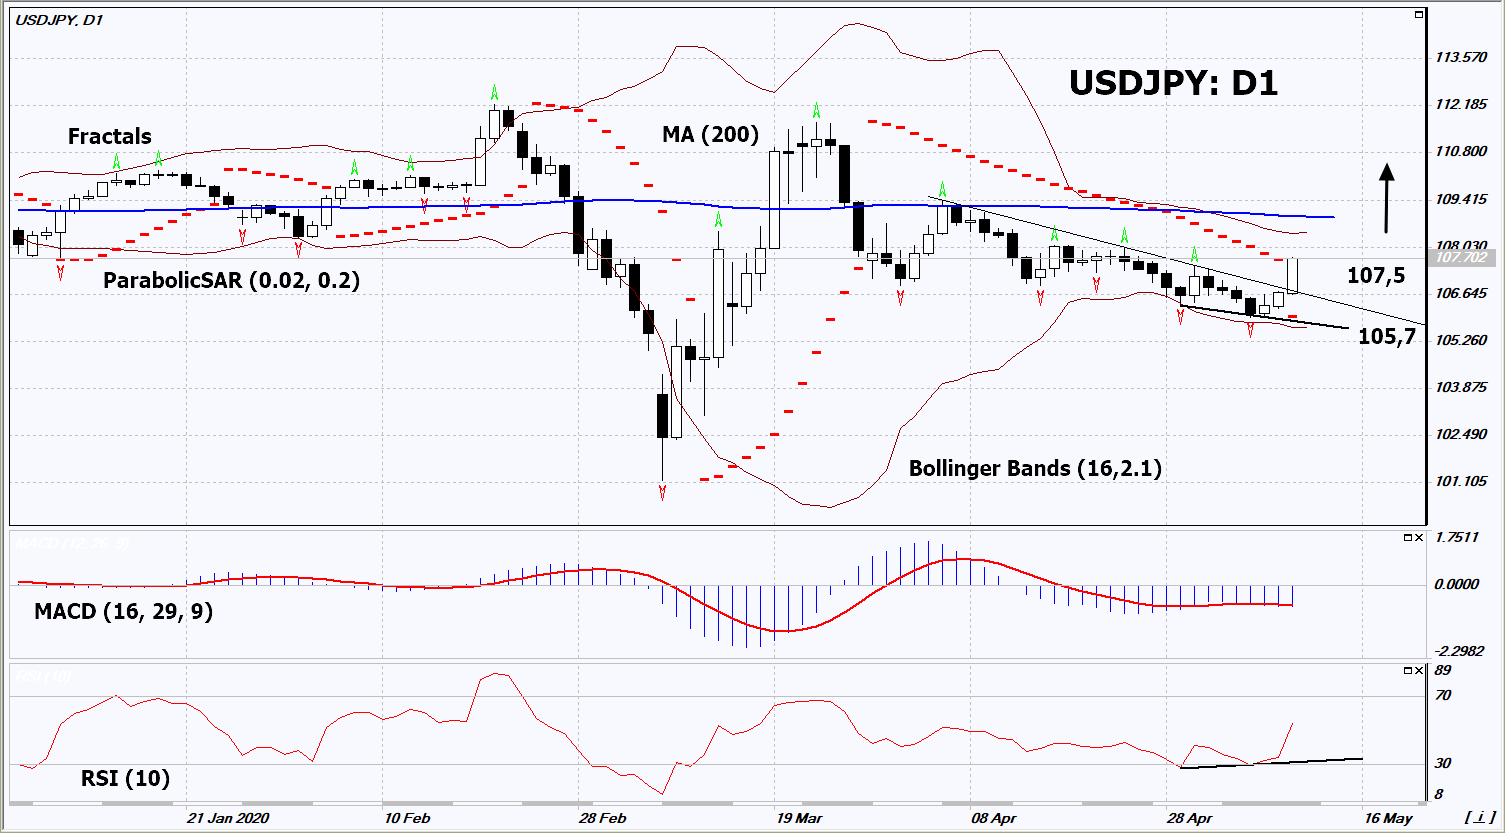
On the daily timeframe, USDJPY: D1 breached up the resistance line of the short-term downtrend. A number of indicators of technical analysis formed signals for a further increase. We do not exclude a bullish movement if USDJPY rises above its last maximum: 107.5. This level can be used as an entry point. We can set a stop loss below the Parabolic signal, the last lower fractal and the lower Bollinger line: 105.7. After opening the pending order, we move the stop loss after the Bollinger and Parabolic signals to the next fractal minimum. Thus, we change the potential profit / loss ratio in our favor. After the transaction, the most risk-averse traders can switch to a four-hour chart and set a stop loss, moving it in the direction of the trend. If the price meets the stop level (105.7) without activating the order (107.5), it is recommended to delete the order: some internal changes in the market have not been taken into account.
Fundamental Analysis
April data on the US labor market were better than expected. This contributed to an increase in the dollar index. Will USDJPY quotes grow?