| Indicator | Value | Signal |
|---|---|---|
| RSI | Neutral | |
| MACD | Buy | |
| MA(200) | Buy | |
| Fractals | Neutral | |
| Parabolic SAR | Buy | |
| Bollinger Bands | Buy |
Chart Analysis
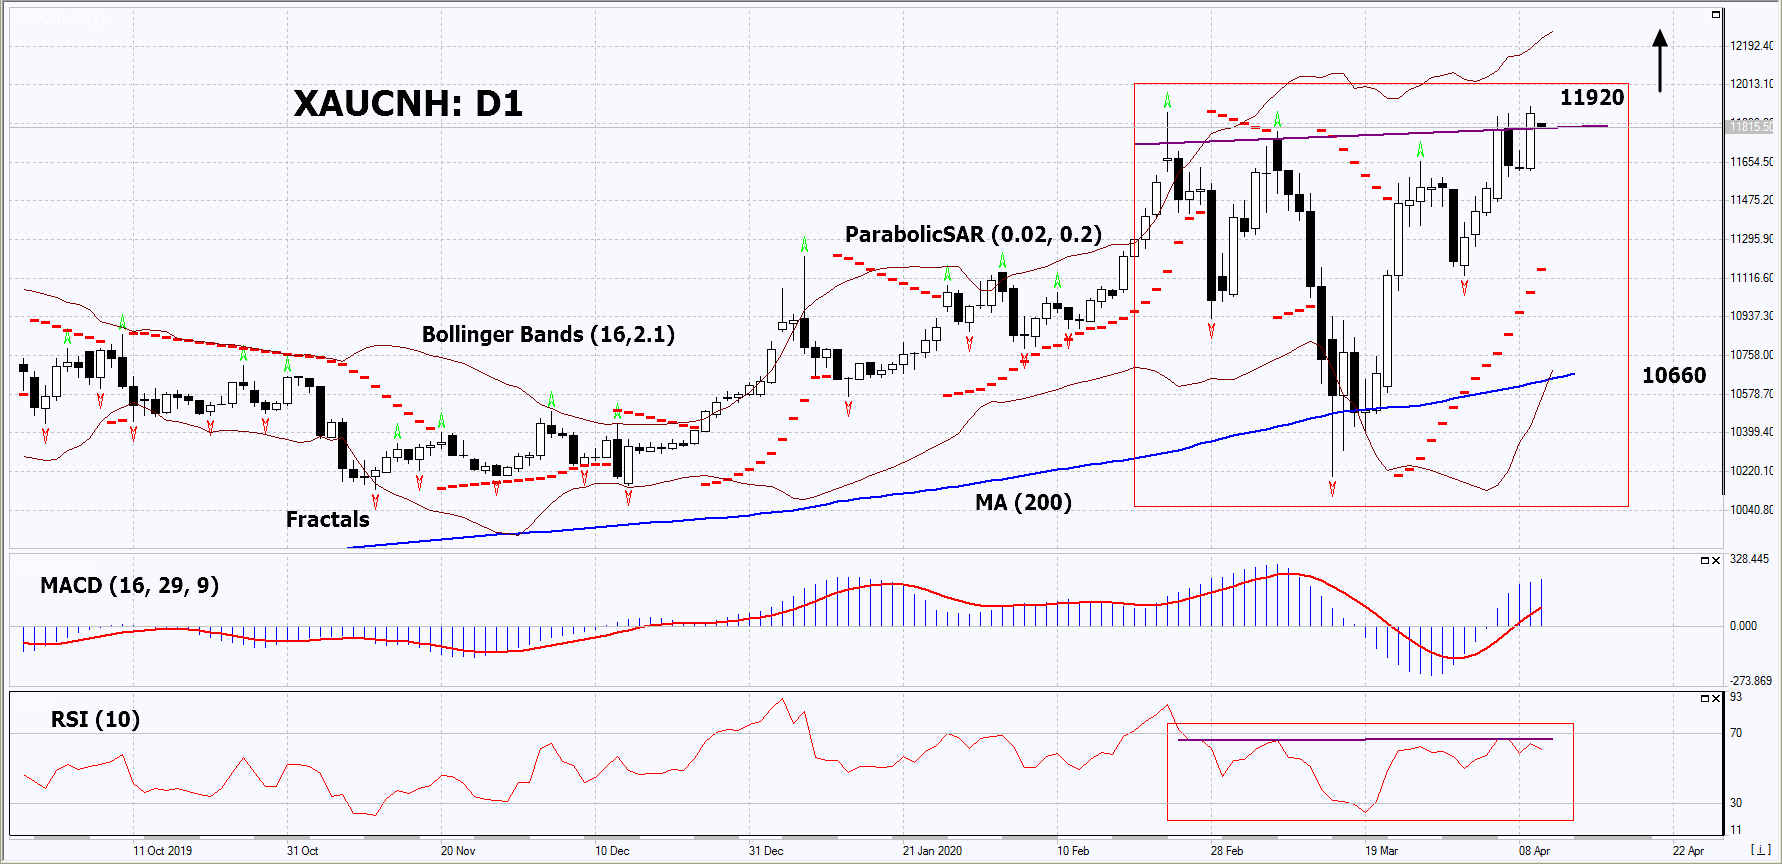
On the daily timeframe, XAUCNH: D1 formed the “Inverse Head And Shoulders” graphical price pattern. It may turn out to be a signal of the continuation of the upward trend, and not its reversal. The “Head”, or the top of the pattern, leans on the 200-day moving average line. A number of indicators of technical analysis formed signals for the further increase. We do not exclude the bullish movement if XAUCNH rises above its last high and the maximum since September 2011: 11920. This level can be used as an entry point. The stop loss is possible below the Parabolic signal, the last lower fractal, the 200-day moving average and the lower Bollinger lines: 10660. After opening the pending order, we move the stop loss following the Bollinger and Parabolic signals to the next fractal minimum. Thus, we change the potential profit / loss ratio in our favor. After the transaction, the most risk-averse traders can switch to a four-hour chart and set a stop loss, moving it in the direction of the trend. If the price overcomes the stop level (10660) without activating the order (11920), it is recommended to delete the order: market sustains internal changes that have not been taken into account.
Fundamental Analysis
In this review, we propose to consider the “Gold vs Yuan” Personal Composite Instrument (PCI). It increases with the rise in the gold prices in the world market and the weakening of the Chinese currency. Can XAUCNH quotes rise?